Thursday, April 29, 2010

Road to /ES 1155

ATT3751608


SPY next week will be around 117?


/ES – move up  BINGO (and what with that aura?) materialized – now lets see how it'll do on the downside..


2010-04-29_1741
Oh …add this chart to the bunch as well (do NOT overlook volume – recently it is as high as it was at February bottom, that my friends is not a "healthy market" as many of inflexible traders who riding long trade would want to think – that, mi amigos – DISTRIBUTION)
2010-04-29_1840
Quick memory trip – It's been great while it lasted - post as of April 22nd, one of the subjects – upcoming EURO long trade (but of course – based on weekly chart – for good long trade we might wait another week or two)

2010-04-22_1653 04-22-2010 2010-04-29_1847 04-29-2010

Yup…money maker…but, sometimes I think I


and I really lose any desire to continue to do so…


Looks like this is the end of the line for IYT
expect may be slightly higher high tomorrow and voila - down it goes in ABC

2010-04-29_1822 
it always falls from new highs and rises from new lows - would not you agree


Bonus chart – Wells Fargo (WFC)
WFC wave 5 – short (1,7 trillions off balance sheet – proposed reform will whack-o-mole it really hard…even just a thought of it…)
2010-04-29_1859 Over and out – hanging up the empty telephone – no posts till Sunday night…may be…

Wednesday, April 28, 2010

BINGO (and what with that aura?)

image April 27 (Bloomberg) -- Federal Reserve Chairman Ben S. Bernanke said a failure to reduce the federal budget deficit may push up interest rates over time and impair economic growth, putting the recovery at risk.

“Achieving long-term fiscal sustainability will be difficult, but the costs of failing to do so could be very high,” Bernanke said in a speech today to a White House commission on the budget deficit. “Increasing levels of government debt relative to the size of the economy can lead to higher interest rates, which inhibit capital formation and productivity growth -- and might even put the current economic recovery at risk.”

Budget deficits may eventually erode the confidence of bond investors in the management of U.S. fiscal policy, driving yields higher on Treasury borrowing, raising the cost of lending in the economy and slowing economic growth, Bernanke said.

Well, well, well – is not it something The Chairman himself says: "We have nowhere to go" – that is what every normal person with elementary math abilities has known for a long time now.

Bernanke has no choice, but to continue deadly game knowing that he lost and the only question is when is the time for payback" - that is precisely what I kept saying for few years now - they are just saving their butts and postponing inevitable catastrophic results.


Now – news from Club Med OR "Idiocy knows no limits" (one of the news is not true – guess which one)


04/28 02:29PM GREEK PM SAYS WE ASK FOR NO BAILOUT, JUST REASONABLE TERMS ON OUR LOANS


04/28 02:02PM GREEK PM SAYS WILL CUT BUDGET DEFICIT BY 4 PCT OF GDP IN 2010


04/28 02:23PM GREEK PM SAYS GREEK INTEREST RATES ILLOGICAL BASED ON MARKET FUNDAMENTALS

04/28 02:52PM GREEK PM SAYS WILL INCREASE MINISTRY STAFF SALARY FOR WORKING SO MUCH THESE DAYS. PLANNING HEFTY BONUS FOR YEAR END IF WE MAKE IT!


And finally updated /ES chart für Ihr Sehvergnügen


2010-04-28_1624

Jobless Claims
[Report][djStar]
8:30 AM ET


EIA Natural Gas Report
[djStar]
10:30 AM ET


3-Month Bill Announcement
[Bullet
11:00 AM ET


6-Month Bill Announcement
[Bullet
11:00 AM ET


52-Week Bill Announcement
[Bullet
11:00 AM ET


7-Yr Note Auction
[Bullet
1:00 PM ET


Tim Geithner Speaks
2:30 PM ET


Fed Balance Sheet
[Bullet
4:30 PM ET


Money Supply
[Bullet
4:30 PM ET

Tuesday, April 27, 2010

No name post. Why? Why not?

Here is a pretty chart (while female traders are away celebrating) – although this chart means nothing … really..

top_models_1440ST_6012
In this post  It's been great while it lasted I arrogantly wrote:
I am talking about that silly annoying rally of hopium, but this is as far as it goes, it stops right here, right now.
The most powerful subclass of equities, non stoppable Small Cap #A hitting the brick wall of Weekly TDST at 751.66.  Today or what is very unlikely, tomorrow, we have seen the highest close of if.

Now we KNOW - $RUT posted highest close (so far) on close of trading on April 23rd - "the NEXT day"

In this post as of April 24th "Lasciate ogne posizione [speranza], voi ch'intrate" I presented detailed/annotated chart of /ES daily (reposting for easier referencing)
2010-04-24_1030
Now lets watch quick vid on "where we are now and what to expect in light of DeMark-ian woo-doo"

For some idiotic reason (is not inability to do something you expect to be doing painlessly always "idiotic"?) I cannot upload videos to Youtube, so, here, kill my Screencast account, suffocate my bandwidth, all of it – have it and eat it too!

Oh, and I forgot to say in videos that IF we are forming babe …wait…I think it is "wave" … "A" on daily – then we are in day #2 and we need "x" days more….you all know theory by now – right?
Vid1 http://screencast.com/t/ZGUzZTc4Y

Vid2 http://screencast.com/t/YjliMzIxZ

DDT here 9AM April 28th
DISQUS is acting up again

Don't forget 10AM petroleum reserves and 2:15 FOMC statement

Monday, April 26, 2010

Naked VPOC close (Guest post by mmTesla)

Ok so the trade I would like to introduce all of you to is a naked VPOC close, reversal intraday trend play. I know it’s a mouthful but it isn’t very complicated. Basically it is the part of the market’s price discovery process and is the most common and agreed upon price. Imagine trading in a 20pt range for a week, breaking out, then testing the naked VPOC to see if buyers and sellers still agree it is a buy at those levels before continuing up. Basically a fancy volume based re-test play.

On this chart are 3 naked VPOC plays that worked this last week. Ovals are either reversals or VPOCs, red lines are naked VPOC levels (key ones anyways). By the way Monday’s low to the tick was a Naked VPOC.

http://screencast.com/t/OWJlZjQ3MW

00000133

Intrigued? So I will show how I traded one of them and then leave the rest up to. 

Ok so we have a buy zone set up by looking at our hourly charts and you can also see the red line (naked VPOC) got closed. How to play it, well green close on the 5min jump in at the CLOSE of the candle and place stop underneath the wicks by .5pt or so, this is an emergency stop, your real stop is if a bar closes .25pts below the middle of the 5minute candle. This trade was good for quite a few points.

http://screencast.com/t/MzRkNDI5

00000134

Managing a trade is the hardest part, I’ve given you my entry plus stop methodology. You can throw on cum delta, if you want (I don’t). The other one that was interesting was Friday. Basically buying came in strong in the morning, off of the hourly buy zone, naked VPOC close reversal easy entry short, MAJOR candlestick reversal which was also a double bottom in the buy zone, easy close and reverse set-up. The other tell was a VPOC shift up during the day that caused buyers to get trapped. A few places for a long reversal on the 5min if you were short during this time, but the 15min tells a nice story with a bearish harami and doji hammer in the buy zone, and double bottom, however the tape was hard to adequately play on the counter trend play. Like I said, managing is the hardest part, the best play for Friday would be to close longs and sit tight and buy back at double bottom. If short the correct play would be to scale out on reversals on 5min and let the market take you out since shorting is counter trend and flip long at the double bottom and hourly buy zone. Definitely a few ways to play Friday’s tape, very difficult to solely play the counter trend Naked VPOC reversal, that is where the other fancy stuff comes into play I guess.

Here are the charts:

http://screencast.com/t/OTlmNTU3Nm

00000135

http://screencast.com/t/MGM1ODU4YzI

00000136

My two cents, if it lines up with hourly buy/sell zones it has more value.  Have fun with it, I hope this helps.


mmTesla

Sunday, April 25, 2010

Fly Eyes and Fiber (FTWR) + Weekly Sector Updates (by Leisa)

Imagine how much easier it would be to be a fly--and with each eyeball you could see 100's of charts at once and assimilate them all. Well, we don't have that, but we have a blogging community and each of us has different 'stuff' that we look at. I want to share with you what my eyeballs look at.
I don't spend much time looking at the individual indices. I figure there are plenty of eyeballs on that. I look at sectors. And when I see something that looks interesting in a sector, I look at ALL of the charts. I found the chart I plan to share with you today in doing one of my sector sweeps. I generally post a link to those weekly sector charts that I do here.
I look at charts very simplistically. I'm not a sophisticated trader like many here, and I hope that my post does not disappoint in that regard. But I do like to focus on the stuff that I think matters for my stye of trading. I look for emerging moves. Either break ups or break downs. I'm not a momentum trader, and it will never be in my DNA to be so. If it is breaking I want to be in position and I want to be selling into the move systematically. I like to focus on volume, volatility and chart patterns--and the price movement of course!
I care about volume two ways: by time and by price. Though it is not shown on the chart below, I frequently look at volatility, and I'll share a post on that if there is an interest. And.. . . I'm also one of those obnoxious folks who looks at fundamentals. It's cursory, but I have to look, AND that look might dissuade OR embolden my taking a position. Now to the chart.
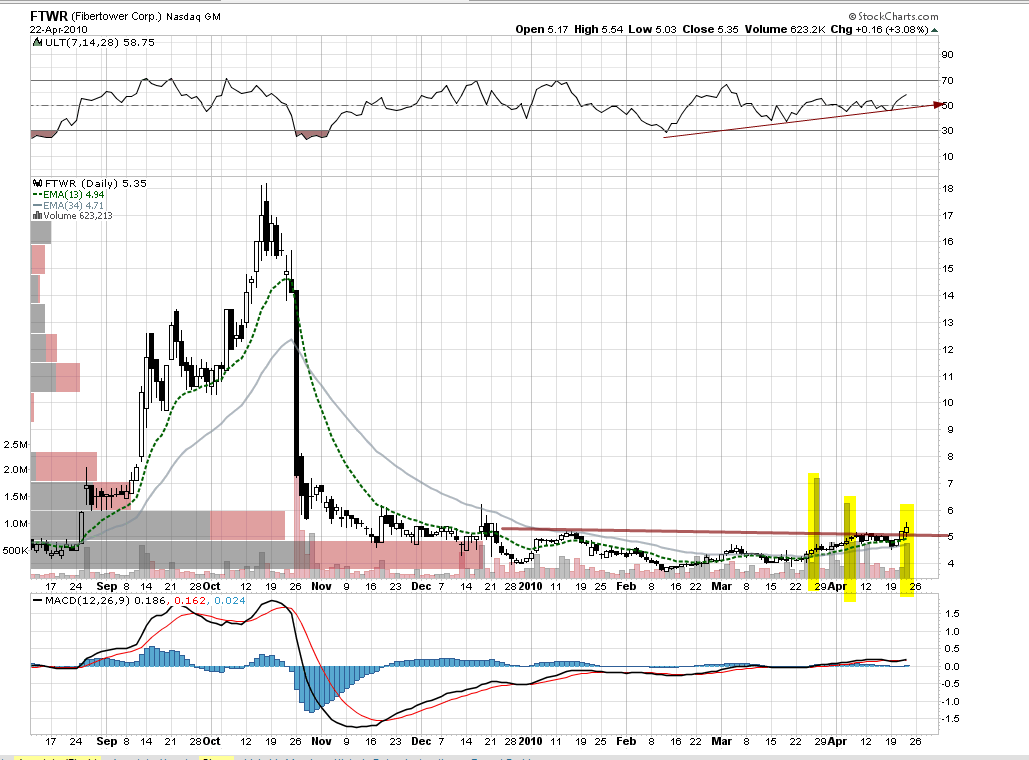
Here is Fibertower (FTWR). It is in one of my favorite chart patterns, a long consolidating base pattern with some volume coming in. This type of chart signifies to my eye, quiet accumulation. I love seeing a long volume by price bar (left bars) at the low end of the price accumulation of this chart. I also like to see significant volume coming in with a rise in price. There is something disappointing about this price action. Specifically, big volume has not resulted in dramatic price movement. Big volume without dramatic price movement means that there is plenty of supply.
I'm in this at $4.25, and I'm holding 1/3 tranche having sold 2/3's into two of the large volume spikes. It has been a very successful trade. Because it is a small stock, AND I've been disciplined in taking my gains, I do not have a stop loss. Your mileage can and should vary. The NICE thing about being a small investor/trader, is that you can trade these names with alacrity that big money cannot. Only you can evaluate your own risk tolerances and time horizons. I'm sharing with you mine for this trade. I believe that if the stock can continue to attract buying interest AND it clears the second volume by price bar with impunity (goes north of $6), there could be a moon shot.
If I see that, I will buy after the moon shot when it consolidates back. With regard to position size, I'll tell you what I did on this. I had 80% of one account in the original position. Though it was NOT diversified for that particular account, that account is such a small size that over my portfolio (geez, that sounds like the Ponderosa, but it is a condominium!) it was not outsized overall. I believe that when I find chart set ups such as this, I'm entering at minimal risk. Risk always increases (in my mind) when volatility is high. Accordingly, I sell into that. I will then re-buy when volatility (and price) comes in.
Position: Long FTWR
Fly Image courtesy of Penn State


 Weekly Sector Update: 04/23/10 (by Leisa)

Below is the summary of the 24 Broad Sectors. You can find the detailed chart book here which contains:

  • A table of the 164 sectors sorted from best to worst performance
  • A graph of the 24 sectors (below), to show a visual of these sectors compared to the total market sector in blue
  • Weekly charts of the 24 sectors followed by
  • Daily charts of the 24 sectors


All data is courtesy of Stockcharts.com | Presentation is courtesy of me

Saturday, April 24, 2010

"Lasciate ogne posizione [speranza], voi ch'intrate"

fantasy-2 Kid you NOT or SP500 Evil Ways As Of February 20th 2009

Yup…that was THAT post…but I am not going to brag about how good I am, but, what is quite unusual for me, I will talk about how good someone beside mightily ME is…
In fact – knowing (theoretically) that market continues to go up (to 1300 something) and trading against my own analysis does not make me a good trader…it rather makes me a …bad … not so great trader…
Anyhow – lets talk about good trader

Fujisan
http://trading-to-win.blogspot.com/2010/02/kid-you-not-or-sp500-evil-ways.html#comment-35772434
2010-04-23_1805
On the very same day (Feb 20th) she did analysis (of something I don't understand…I am one DeMark tracked mind), but her analysis looked pretty…accurate, convincing…and proved to be …ehh…dead wrong…

2010-02-21_1901
http://content.screencast.com/users/Fuji-san/folders/Jing/media/bec68652-2bbc-4a6f-b46a-1388cc02c0f7/2010-02-21_1901.png

But hear me up – did she pay any attention to her mistake prediction that did not materialize? (we all do our best trying to predict direction/action and we all have our share of failures) Nope – she turned 180 around like nothing ever happened  and continued successful trading based on yet new variant perception/charting.

Moral – if we wrong (and we are wrong a lot) – cut your damn losses/position/change mindset and go on with trading life…or stop trading if you cannot do that (have to admit – as I age it is becoming more and more difficult to recover from mistakes mentally and financially)

Now back to my usual DeMark-ian mambo-jumbo
Here is an updated (Kid you NOT or SP500 Evil Ways As Of February 20th 2009) chart – do not take it literally – this is JUST A CONCEPT with the final destination for up ugly leg we are in.
2010-04-23_1808

2010-04-24_1030
Really wanted to plug video here with detailed analysis of my as wrong as possible trading of Thursday's selloff, but it will be too much for one post – remind me and I will do that video – loss could have been avoided very simply…it is always something simple – is not it?

P.S. Guest posters – please coordinate with me when you will write/post so we would not post 3 posts within 2 hours – that would diminish the whole idea of keeping blog busy.  As of now I have 1 post which I will publish Sunday night/Monday morning (THANK YOU Leisa!!)

Thursday, April 22, 2010

It's been great while it lasted

I am talking about that silly annoying rally of hopium, but this is as far as it goes, it stops right here, right now.

The most powerful subclass of equities, non stoppable Small Cap #A hitting the brick wall of Weekly TDST at 751.66.  Today or what is very unlikely, tomorrow, we have seen the highest close of if.

2010-04-22_1652

D-wave daily

2010-04-22_1706

And, surprisingly (update on EURO) - /6E closed today way above low and right at that yellow trendline…interesting…

2010-04-22_1653

And last, but not least – beginning tomorrow I will be 100% absent from DISQUS while I have any trades on – I finally realized that my trading (as some of you recall I have severe case of ADD and can barely handle one decision at a time ) and chatting during the day are 100% incompatible and cost me

VERY

BIG

MONEY

in opportunities lost.

Sorry gang – that is MY PERSONAL PROBLEM and that is The Only way to deal with that.

(charts requests, chat, opinions – I am here at nights)

Wednesday, April 21, 2010

EURO – goodbye or good buy?

2010-04-21_2059 Variant perception:

Stock market will go down, commodities will skyrocket, dollar will go down (no correlation with market going down), EURO UP (As oppose to common belief as of now that common EU currency is extinct and gone and will be replaced once again by local currencies…listen to THIS: "PEGGED TO EURO" – UH-HA!!!)


Please note – since in that video I am doing everything possible to convince myself and you as well that "it is symmetrical triangle" – then it MOST LIKELY IS that down sloping channel!


2010-04-21_1930 2010-04-21_1929

Chart of about to be rotten (?) Apple ( AAPL) #2

Below is an original post dated May 30th 2008

Picture worth a thousand words, take a GOOD look at weekly AAPL chart with DeMark buy/sell signals and DeMark trendlines - I think that depending on today's ( 5/30/08) close Bear might just have another New Year's present. I am short AAPL, RIMM, QQQQ


On a positive note I have to express my admiration for CNBC who...s who try really hard to "keep straight face during the loosing game" - that is what they getting paid for - right?


[END OF ORIGINAL POST dated May 30th 2008]

~~~~~~~~~~~~~~~~~~~~~~~~~~~~~~~~~~~~~~~~~~~~~~~~~~


And here is today's "Picture worth a thousand words" chart.  It is right before market open and does not show the last pop of the last crapomania [tulipmania?] producer on the planet stupid.  At least there is plenty of this type of crap…but friend of mine is waiting for 2 month for his preordered Mossberg Tactical 12GA.  Interesting…


2010-04-21_0848

But… don't worry, be happy, sink smiling…

Tuesday, April 20, 2010

Kindergarten full of bulls

self-cleaning-toilet-paper


(there is NOTHING about stock market in this post – so you are free not to waste your time reading it)

It never cease to amuse how full of self pride Bulls are. After every single up day (and there are plenty of those) they hug and kiss and lick and suck and talk and cheer and everyone is coming up with yet another upward looking pattern and when it does not work – some "other pattern" does work.

But yet, when they have to call downside target or better yet to spot the turn – they ALL fail.


I truly don't know if I am more annoyed by one sidedness of the market or these bullshitos getting together patting each other on the back. 


I have tried to stay away from a lot of biased blogs, was banned in the past for criticizing people like Tim Knight, but right now I am really getting fed up with all encompassing bullish arrogance.

The ONLY credit that bulls might claim is that entire rotten dying corrupt system trying to support its very existence with unlimited money supply just in order to reanimate that forever dead perception that "capitalism and as a biggest part of it – USA – is still alive and kicking"

Earnings don't matter, chart patterns don't matter, political parties don't matter, nothing matters – yo – bulls – it is not because you are so smart – it is because you ignorant enough to the suffering of majority of people in what some people are arrogant enough to call "the richest country on Earth". 

Most of you missed June /July correction and equally got screwed up on July 11th bottom because you all were expecting pretty H&S pattern to play out, most of you did not spot January top…equally you, bullshitos, did not spot February 5th bottom.

And – the only chart that most of you, bulls, needed from the March 2nd when you were nowhere to be found because ALL of you were crying and hiding and I called The Bottom is THIS.  You are all saved by the bell, but it will NOT ring forever.


2010-04-20_1901

End of rant (toilet paper for bulls provided free of charge)


THIS is NOT capitalism, this is OLIGARCY – and I think even fat and lazy about to had enough…

P.S. Of course it is not bulls who irritate me, but rather arrogant, always right people…

Monday, April 19, 2010

S&P500 nightly update

Since a lot of us have really short attention timespan I only post 5 and 15 minutes D-Wave charts for tonight


2010-04-19_2101 2010-04-19_2059


Sunday, April 18, 2010

Guest post by mmTesla

Friday was an excellent day for Bears. I was going to do a post about Thursday intraday trading, however today was absolutely spectacular and important for you swing traders. Therefore this post will be devoted to a bullish perspective, however any clever bear will also know the oh shit points for dem' bulls.

Alright, well the GS scandal was no doubt the catalyst today, however look at where we turned today:

VPOC

This is an untested volume point of control from before we broke out of the 1185 range. Basically it was the most accepted price for buyers and sellers. Everyone was content and in this case we moved upward. The scary part is that down to the very tick 1182.75 the ES turned around. What this means is that we tested this area and it was once again was accepted by the market. Strong buy signal.

Now for the first day since we crossed the 8ema off of the 1040 low, we have finally closed below the 8ema. This is VERY alluring to me. Now at the bottom of this chart, notice the volume for today. Biggest volume we have seen in a very long time, this also happens to be on the confirming candle off of the doji we made yesterday. Red line is from naked VPOC that we tested today, also notice the trendline we broke today.

Change in the winds?

At about 1165-1170 we have support from the fib fan that starts at the 1987 black swan low to all time highs. After that the next real support is at 1145-1150, we have the trendline from the 2002 low and 2003 re-test. That level is also the previous swing highs, so a close below that makes this rally a false breakout of the double top. I would also assume that around these levels big time frame players will be rotating their portfolios to being more bearish.

A few levels to watch.

So on the short term, we received a buy signal intraday (big surprise) so we may see a bounce Monday, possibly through Tuesday. Slightly longer shorter term, we have volume confirming down candle on the daily, what is important is a close past the midpoint of the body of the candle. While today was an excellent day, we have some very tough places to overcome and "buy the dip" is still very valid at this point, until we capture those levels.

This is how I think the transition into the intermediate term will play out. We will have a correction of about 5-8%, which we may have seen the top of yesterday. I don't think we will see 1225 before we correct. Anyways after this correction I picture us moving up and past 1225 and into the very high volume area above. This is where I think our topping pattern will occur. Politically by the time this folds out, we may actually see some improvement in the economy so the politicians will focus on that rather than the market. At that point they can relax and let the market correct, I do not see a crash like before because that would cause panic, however a steady grind down is more likely in my opinion.

Friday, April 16, 2010

Weekend at DDT's #198,092

Humor-125 DDT joked about shedding tears when the smack down began this morning, but I seriously was in tears over here once I absorbed it all. It was the first time I've cried in a long while, because I've become so used to steeling myself from what has felt like the largest heist in economic history. Both of us have genuinely just wanted for all of us to succeed this year, so to see a day like this unfold is beyond description. This group of TTWrs has endured snipes, passive aggressive comments and other snark about being short this tape- you name it- we've not had an easy time of it for many months. Many of us have held our tongue more often than those snipers will ever know, and it hasn't been an easy pill to swallow. On the flip side? The bulls have also endured more than they deserved in many ways by just trying to trade the trend- that's been their cross to bear with those who haven't traded this rally well. It's important beyond anything else that we are on the same team. It doesn't have to be the same page, but the same team is all that counts. And maybe this is a one day event- I mean.. we don't know what comes next, but days like this are truly a gift for those of us who stand by watching this joke of a tape day after day, listening to blatant lies and deception through it all. This gift today is ours to keep after countless hours of research and sharing. Yes, the money is great of course, but for some of us this goes way, way beyond the money. Some of us actually care about truth, justice and the good guy finishes first, not last. You'll note that this group is chock full of people from around the world who share that same spirit- it's not pinned to one country - it's something you're born with. If that's trading with emotion, so be it. I'd rather trade with emotion and reality based thinking than be an empty shell of a human being any day of the week. I don't need my epitah to say, " She traded like a machine." Big deal, and no thanks.

Early on in the year I posted this video/song below and said it would be my anthem for the new year, and so it remains. You have all remained as sane as you possibly could, encouraging each other with true commraderie- good on all of us for that. This is a humble zone - and you'd be hard pressed to find that elsewhere in the blog-o-sphere, but that's what makes this little cave shine. DDT and I have both wondered whether trading was even worth it anymore- whether trying to keep the blog going was worth it. Days like this pretty much answer that question for both of us. We'll have more days of doubt, and more days like this too, but we've at least stuck it out through some pretty mind bending times, to say the least. For me- you have been a real rock in more ways than you'll ever possibly know. What an inspiration you are. Many, many thanks to all of you. We once again have some newbies this week- we welcome you all and hope you'll enjoy what we've all been spoiled with since DDT let us run amok on his blog over here.

Go enjoy your weekend traders... and take a minute if you had a good day to go hug someone you love... or a perfect stranger if that's all that's handy. Pay it forward. Well done.

P.S.- share your charts if you are so inclined.. I'll be back on Sunday with my own chart stash too. We'll huddle and re-group for the week ahead as best as we can.

Thursday, April 15, 2010

Sell a billion for a dollar – good deal!

mime-attachment
I've been having a very tough time lately trying to figure out – who BO reminds me and here it hits me - "THe wiz Kid who for only $49.95 will sell you the secret how he made 84Million dollars in one year"
And this realization fills in all the blanks and makes me feel sorry for people who fall prey to the very same type of promises to make them rich and happy with no efforts or thinking from their side.  Sucker is born every minute and too bad I always underestimate the stupidity of humanity, I am no Einstein indeed.

Speaking of stock market – OpEx week is over tomorrow, GOOG cooled down after close, futures down so far, but like weather in New England it might change in 5 minutes, VIX completed countdown 13 (and concurrent setup buy as well)
 2010-04-15_2035 Not to repeat a lot of charts, but weekly charts have lined up full of sells (Bulls call those "breakouts" and in "normal" market they getting their guts handled to them with fresh blood when they try to play those so close to corresponding TDST lines.  But this is not the normal market – it is the battle for survival of cornered animal and we know what such animal capable of doing…anything and everything.
Interestingly enough – I don't know who I am sick of more – BullShit market or GoodKids BullShitos who's got all their lives planned for them even before they were brought into this stinky world – the very same assholes who think that minimum wages are bad for business.  My friend FU asks such people – have you tried to survive on that? 
What can I say – I am as disgusted with Bulls now as I was annoyed by Idiot bears back in March 2009.
On a positive note – huge Thank You to all regulars on Disqus – to every single one, this is a great team and not a single one bringing bad vibes even when one's stated opinion is in contradiction to "majority way".

Good joP chaps!

And as an added bonus enjoy (IF you capable of understanding an irony of coming to USA from USSR and seeing the same shit in the different country)

here is the link to striking similarities portrayed by young Robin Williams – please, DO read subtitles.   http://screencast.com/t/ZWU1MTA3N

Full Movie Moscow on the Hudson

Wednesday, April 14, 2010

Treachery and treason

Boy did I want to look smart and show you few charts and say:
"Easy ride is over – air pocket is gone, now there is going to be a fight for each 1c on SPY"
2010-04-14_2032 Would not a lot of you LOVE that chart – is not that what we WANT?
Then I turned to QQQQ and …the "Air Pocket and following heavy volume zone" means…nada, zilch, null, nitchego…
2010-04-14_2034 All ISEE, overvaluations, nonsensicality, obvious disconnect of "Their economy" with "our suffering" (most of us, even in the families with 2 people working are unable to just GET BY) , all the logical reasons mean NOTHING – for as long as there is that stupid portfolio manager who is dumping someone's else money into bottomless hole called "efficient market" and for as long as there is even more stupid portfolio manager willing to pay the greater price – this "rally" will be going on.  It is 100% similar to tech bubble, to housing bubble – everyone knows it is bogus, everyone knows they are selling air to fat and lazy, but this is their game and that game will be played until it is stopped by some unforeseeable forces…
Game on…and it will end when least expected…NOW?

Here some treat for you – someone said "CNBC people" started to connect higher oil price with better economy (morons) – here is TDSetup Sell 9 Weekly after 13 count known as 9-13-9 – let those ..kers buy…
2010-04-14_2042 Enjoy the clip (in the very beginning there is some stupid sound/visual effect by one of "the people" who thought that was cool, but that is The Best sound there is out there).

Treachery and treason
There's always an excuse for it
And when I find the reason
I still can't get used to it
And what have you got at the end of the day?
What have you got to take away?
A bottle of whiskey and a new set of lies
Blinds on the window and a pain behind the eyes

P.S. Well well well – I think I found the charts everyone is least expecting…

2010-04-14_2126 2010-04-14_2127