Tuesday, June 29, 2010

Revenge is not sweet?

Since I've been totally out of sync with "overnight/next day action" (How about my yesterday's speculation that we will have market water torture for next few days? –3%?? Rrrright…) I decided not to post any charts this time, not to state any "opinion" and just dedicate this post to some meaningless rant.


Market diving today had to bring a lot of excitement into my day (according to some people this blog is one of the "bearish" blogs after all), but it most certainly failed to do so.  Not even because I was 100% flat overnight (I am not trading too actively lately – I am occupied with different "initiative" right now) and I "wish" I was short, no – I am really contempt with being "out of the trade wishing I was in" as oppose "getting annihilated in the trade wishing I was out", but, I think, that is because in spite of the ability to see that "economic improvement" was/is nothing more than a smoke in the mirror and, therefore been extremely skeptical during this "recovery rally" – I am not a bear, I am just a regular Joe who wants things to get better, who wants to have hope and who is getting hurt by negativity just as much as who we, people who TALK instead of acting and leading, call "sheeple".


So when I see market plunging I see the air of empty promises letting out of inflated non productive what is left of economy balloon, I see CONgressmen who have NO IDEA what they are mumbling about and who are not even capable of hiding what lobby has them.  When will they realize that it is not all about reelection game, that there are real people who already suffering and will be hammered into zombie like existence if things will continue the way they go (and I am very doubtful that anyone even remembers that propaganda cheap motto of last elections… CHANGE.  Shovel it where it belongs for a change…)


I see continuous looting of this country by everyone "who can", I see people not able to find any jobs not even speaking of the job corresponding to the level of their expertise, I see lines at soup kitchens and social unrest (not sure about that one – it seems that we are so sedated that nothing can take us away from Tout TV/American Idol)

So, NO, I am NOT happy to see this country go down…

Monday, June 28, 2010

CSCO - DeMark-ian "Picture Perfect"

Since I don't see any "as of now" good trades, here is a little history – was this "tradable" or what?

2010-06-28_1509 Shorter term as of now it is a mixed bag with a hint of long trade – on 4 hours chart you see it penetrated prior TDST on bar 7 of buy setup, but there was no follow through on the downside – some bounce is coming?

2010-06-28_1602

Overall – next few days (just a speculation) might just be a water torture – I'd be spending more time in the pool

Sunday, June 27, 2010

Weekly Sector Update | 06/25/10 (by Leisa)

[The Perplexed Investor]
I have something wondrous to share with you:  Weekly Sector Charts with a twist!  I was up early this morning, and I had a thought noodling in my head. I was interested in what the short interest was for the various subsectors. I decided that I wanted to create (for you and me!) a sorted list on that.

For that I went to FINVIZ.  I calculated the number of short shares (% of float short x float).  I then multiplied that by the share price to come up with the market value of the float that was short.  The table that I prepared had % of market cap short and % of shares short.  I've a new/fast computer, and this process taxed the resources.  I've included the report within my sector report.  I hope that you will download the full report. You will not be sorry, and I guarantee that you will see some things that will surprise you!  It is in PDF, and it is very easy to read.  You can find it here. (All charts herein are included).

Let's take a look at the Weekly Sector Graph. You do not have to adjust your screen.  The 24 sectors are all negative.  Only 5 of the subsectors were positive.  The broad market index was down 3.7%.  As usual, individual sector mileage varied, which is why I put these together.


[source:  data from StockCharts; click to make larger]

Now let's drill down and look at the subsector 10 best/worst performers.


[source:  The Wall Street Journal; click to make larger]

I wish you happy trading next week.

Thursday, June 24, 2010

Small Victories

“Victory is won not in miles but in inches. Win a little now, hold your ground, and later, win a little more.” - Louis L'Amour


Watching the U.S. Soccer Team at the World Cup yesterday reminded me of how much preparation happens before one small victory. Anyone who has traded for any amount of time know it’s the small trades that will see you through, rather than always looking for the “big hit.” Let them add up and they equal a “bit hit.” Imagine the work these players do, the injuries they endure and the defeat they’ve swallowed just to kick that ball into the goal.. even once! That is the business of trading in a nutshell.


Inna mentioned, and I’m sure many of you noticed, the normal correlations were extremely wonky today. What this means is not clear, but should be monitored closely going forward. Is copper giving us an early sign of a bounce? Is the Yuan teaching the USD a lesson here? It’s hard to know imo, but let’s stay on guard going forward. DDT also asked me in private if we could be seeing a resurgence of a stock picker’s/sector market here? This was the case back in December/January for sure, so let’s keep an open mind to the possibilities to be had. As far as the volume issue is concerned, I pondered if the low volume on the sell-offs today has something to do with fund managers moving into long positions before Monday’s close, but it’s helpful to also remember this is the summer season, and volume is typically on the light side anyway, and in both directions.


We still have the RUT re-balance tomorrow, GDP, EOM, Quarterly end, quarterly options expiration, G-20, the Financial Reform Sham.. and who knows how many other things on the table at this point. I trade the charts, but remain well aware events like those mentioned are “used” to move the tape. Time for some charts, and DDT will add his in later on if he has any energy left and takes mercy on us tonight. :-)

spy_daily_eod_6_24 spy_monthly_eod_6_24
qs_daily_eod_6_24 vxx_eod_6_24

Instead of my usual music, I came across this the other day and thought you’d all enjoy not only the fantastic music, but the fractals. Enjoy!


~~~Keirsten~~


image


    ~~~Osikani here~~~


Is the bear rampaging, or is it just another trap?


Today's market update. This time we use both the SPX and the SPY.

We are now in full bear mode.

First the Day Tracking Osi Analysis. The legend is on the chart, but everything says "bear".

2010-06-24_2034

Next is the VIX cross. It too just indicated short. The picture is totally messed up by the Casper VIX print. I guess I have to rewrite the code to take care of ignoring outliers. If I do rewrite it, be assured it will still be free. I like the feeling of having given back for all that I have learned from the blog, and in any case, I still do not believe that general knowledge of a method makes it stop working. I find it hard to see how the market makers can game the VIX, in any case. It is just too big. In any case, as I posted earlier in the day, the cross had already happened. We were just waiting for EOD, to be sure that the cross remained.

2010-06-24_2043

Next comes a look at the Guppy Multiple Moving Average System.

The picture speaks for itself. The long term moving averages have certainly held as resistance by all descriptions:

1. They remained roughly parallel in spacing.

2. They are pointing down.

The short term moving averages bunched up, as happens when traders fade a strong move, and have resumed their downward trajectory.

2010-06-24_2053

Next comes the DeMark (+ extras) lookee see.

Again, the picture tells the story.


2010-06-24_2056

Wednesday, June 23, 2010

10 year treasury note

Last time I mentioned it as a good trade was back in June 2009 when weekly Setup Buy completed and it sure was nice long trade right off the bottom (not to overlook Karl Denninger's constant shouting that "it is going to 0!!!! No matter what they do!!!!"  Damn maximalists…


Getting back on topic – now weekly sell setup completed 2 weeks ago, but it was not perfected (meaning "bar 8 OR 9 must be higher than bars 6 AND 7").

We have upside momentum now and also looking at daily chart – ongoing Sell setup as well. I am watching 122'035 for possible short entry for /ZN


2010-06-23_1952

 2010-06-23_2000


I must say again – what a great community of traders/personalities we have here, I have never seen – anywhere else – such an active participation, total absence of useless anger, minimal unproductive cursing (especially since I keep my mouth shot during the day) – my kudos to ALL OF YOU!  That is what this site IS about – not me, not even about Special K – it is about place where everyone feels home safe.

THANK YOU ALL!

Tuesday, June 22, 2010

And the bears said, “Woot!”

.. but not so fast, we have FOMC games tomorrow, so let's stay on top of our charts and be ready for what they have up their sleeves! The intra-day charts are getting a bit long in the tooth in the oversold territory, but you know what they say, "selling begets more selling," so have a plan for both directions tomorrow if you chose to trade. I used to forgo trading Fed days, but now and then I get a little crazy and dive in with the rest of the adrenalin junkies. We'll see how things unfold pre-announcement. Be careful either way.

Once again TTWrs- great team work today, and what a good group to have as co-collaborators every single day!  Just a few charts to share of interest, and to our lurkers or newbies:  please don’t hesitate to post what you have up your sleeves too.  We welcome any and all trading methods on TTW and are chart-a-holics, so don’t be shy.  ;-)  The more things we can throw at this tape, the better!


For those who like to follow Larry Pesavento, here is a link to a short audio he did yesterday- just scroll down to 6/21. 


spy_large_6_22_eod spy_daily_eod_6_22
iwm_eod_6_22 qqqq_6_22_eod


In honor of Argentina’s nice win today at the World Cup, I present again, Bajofondo… time to Tango!


DDT here with "Daily Puzzler" (Or is it "PotzLer"?): "FIND THE CHANNEL"

(well, I think it is more like 6 channels, but price bouncing off different bands quite accurately.  Down to 1077 tomorrow and up after FEDsters?


2010-06-22_1723

Monday, June 21, 2010

Lets get right to the Chase

In this latest "off May's bottom rally" Financial Sector was definitely a "dog" – underperforming other hard hit sectors.  Should it be looked at as a potential long candidate?  Lets take a look at JPM.


Daily chart is at day 5 of ongoing Sell Setup – in insulation there seems to be more upside left.  But this "first impression" might be deceiving, beside – bearishly biased fellow traders would say that Chase is not up to the races.


2010-06-21_1918 

And – here is weekly chart of SPY – as you can see TDSequential Countdown 13 completed last week – short? But wait – immediately – Setup Sell started

2010-06-21_1923

Am I making myself abundantly clear?  Not?  Right – what kind of clarity would you expect after 4 doji days in a row?  And totally mediocre volume?

That might look like "bearish engulfing" on daily – but I really stopped paying any attention to candles long ago, unless those are hammers/shooting stars on high volume.

What I am trying to convey here is that market is most likely in the sideways mode till at least after Independence Day and unless you are scalping – there is no clear edge and patience is a virtue (I can say it again…to myself)…except carefully scrolling over SHIPPERS' charts and finding long candidates?

Sunday, June 20, 2010

PM Summer Doldrums 2 (Adam Hamilton)

PM Summer Doldrums 2

Adam Hamilton     June 18, 2010     2625 Words

Over the past month or so, precious-metals stocks’ performance has been frustrating.  Even though gold looks great, lazily meandering over $1200 without a care in the world, the PM stocks have drifted sideways to lower.  Unfortunately such behavior is typical in the dreaded PM summer doldrums.

These doldrums exist because strong seasonal forces affect gold demand.  While gold’s newly-mined supply flows to the markets at an essentially constant rate throughout the year, this metal experiences wild fluctuations in demand.  And unfortunately none of the usual demand spurts coincide with summer.

Asian gold buying ramps up in autumn as cashflows from the recent harvests peak.  Farmers invest once they know how big their profits are.  Indian demand, the world’s largest gold consumer, surges during its autumn festival season.  Most Indian weddings happen then, with big gold buying for brides’ dowries, as Indians believe getting married around these festivals brings good luck and happiness to marriages.

Around Christmas and the end-of-year bonus season, Western gold buying peaks.  Christmas is naturally the biggest time of the year for the gold-jewelry business.  And similar to Asian farmers buying gold after their harvests, we Westerners have the best idea of how much surplus income we’ve earned that year near year-end.  This leads to Western gold-investment buying.  And then in January and February, Chinese New Year gold buying flares up in China.  My latest essay on gold seasonals delves into these gold demand spikes in more depth.

Note that none of these seasonal surges in gold demand around the world happen in the summer.  This time of year is devoid of income-cycle and cultural incentives to drive above-average capital flows into gold.  On top of this, investment in general really tends to slow down in summer as people concentrate on vacations and enjoying the sun instead of the financial markets.  The result is the summer doldrums.

Gold tends to drift listlessly sideways during these summer months, like a great tall ship trapped in the oceans’ doldrums.  There generally isn’t much selling pressure, but there isn’t much marginal buying interest either.  And as goes gold, so go silver and the precious-metals stocks.  These are derivative plays on gold, so when gold isn’t doing anything exciting they tend to drift lower as traders get frustrated and walk away.

In the financial markets, summer effectively runs from Memorial Day to Labor Day.  Thus calendar June, July, and August are the summer months for trading purposes.  While PM-stock speculators and investors are never happy to hear about the summer doldrums this time of year, the technical histories of today’s PM bull markets are crystal clear on the reality of the doldrums’ dampening impact.

The charts in this essay illuminate these doldrums in gold, silver, and the flagship HUI gold-stock index across their respective secular bulls.  In order to make each year perfectly comparable with all others despite wildly-different price levels, I indexed every summer individually.  The final trading day in May each year is set at 100, and then all other prices are figured relative to this common base.  If gold goes from 100 to 105 for example, that means it rallied 5% whether it started at $400 or $1000.

All past years’ individual summer indexes are rendered in yellow.  While your eye can’t follow each year individually, taken together they define a typical center-mass trend.  The summers’ indexes from 2000 to 2009 are then averaged together in the red line, illustrating the core directional tendencies.  And finally this year’s indexed data is rendered in blue.  Every PM-stock trader needs to understand these doldrums.

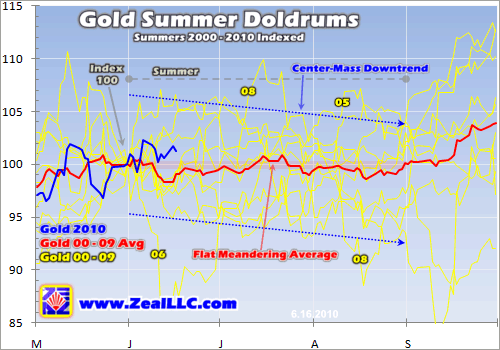
Over this secular gold bull’s past decade, this metal has never had an exciting summer performance.  Not once!  The center-mass trend of all its summer trading action over this long span is clearly down.  While there are some outlying years like 2008 and 2005 to the upside, these anomalous rallies quickly rolled over and failed.  On average between 2000 and 2009, gold drifted sideways in a flat-to-lower fashion.

And despite today’s excellent gold prices, in indexed terms this metal has essentially spent the initial weeks of summer drifting sideways just as expected.  Gold closed near $1215 on the last trading day of May 2010.  Since then it has lazily meandered between $1206 on the low side and $1242 on the high side.  Even at its peak gold was only up 2.3% since the end of May, which remains near the center of its typical summer-doldrums trading range.

Now this precedent doesn’t mean gold can’t rally sharply in the summer, far from it.  Anything is possible in the financial markets.  With the right incentive (read “crisis”), gold investment demand could soar even in the lazy summer months.  But speculating and investing are ultimately probabilities games.  Traders only want to add trades when their odds for success are high.  And for an entire decade, the odds haven’t favored gold rallying in June, July, and August.  This doesn’t bode well for summer 2010.

Each time I’ve written about this phenomenon in the past, I get deluged with hostile feedback.  Highlighting a period of poor seasonal performance doesn’t exactly win fans among PM-stock traders.  The most common argument I hear is “What about X event?  If X happens, gold will soar.”  And usually I agree, if X comes to pass then gold investment demand would indeed probably surge.

But the problem is wild exogenous events seldom become reality.  While the threat of Xs always exists, the reality is they almost never hit as feared.  Last summer for example, fears of a California bankruptcy and double-dip recession dragging the stock markets back down to panic lows were ubiquitous.  Potential Xs were everywhere, yet gold did nothing.  In the summer of 2008, the bond markets were seizing up as Fannie and Freddie stocks were plummeting.  Gold had every reason to soar as Xs loomed everywhere.  Yet the best it could muster was a short-lived rally in July that soon collapsed. 

The cold hard truth is nasty potential Xs existed in every summer from 2000 to 2009 without fail.  Yet gold still steadfastly refused to surge higher every summer.  Worst-case scenarios always exist and are always feared by excitable PM-stock traders.  Any potential wild exogenous events today like a Europe implosion are both highly unlikely to come to pass and equally unlikely to drive a huge summer gold spike.

You don’t have to like this, I certainly don’t either.  Our goal in speculating and investing is to buy low and sell high, not irrationally expect any asset to rally 12 months a year every year from now until the end of time.  The charts don’t lie.  Any intellectually-honest PM-stock trader who takes the time to study summer trading action over this entire bull will have to admit it isn’t very impressive.  This lethargic flat-to-lower gold price action in June, July, and August drives the PM summer doldrums.

Silver is a leveraged derivative play on gold.  When gold is strong long enough to generate excitement, traders rush into silver and drive big gains that amplify gold’s own.  But when gold is weak or even drifting sideways, excitement for PMs fades rapidly.  Traders sell silver in the absence of a gold-strength catalyst to drive further buying, and it falls faster than gold.  So with gold tending to drift sideways during the summer, silver faces a stiff sentiment headwind that it can seldom overcome.

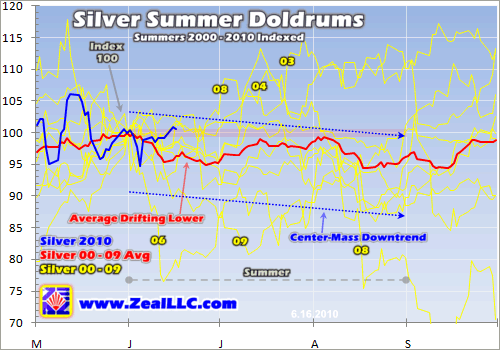
Silver’s summer action isn’t as tight as gold’s over the past decade.  The yellow lines showing individual indexed years have much broader deviations, reflecting silver’s well-deserved reputation for wild volatility.  Yet on balance, silver’s summer tendency is still clearly weak.  Its center-mass trend encompassing the most yellow indexed lines is down.  Even more telling, its red index average drifts down about 5% by the end of summer.  If silver follows precedent this year, odds favor it trading in the mid-$17s by late August.

Unlike gold, silver did have several years with upside outlying rallies during the summer.  The most recent was 2008, when silver followed gold’s spike higher in early July.  But soon after that in August that year, that anomalous strength quickly collapsed into anomalous weakness.  2008 ended up being silver’s weakest summer of its entire secular bull as the bond-panic-driven US dollar spike hammered gold.

The other silver upside outliers were 2003 and 2004.  In 2003 the general stock markets, which have a huge influence on silver traders’ psychology, were advancing out of their recent bear-market lows much like we saw in the summer of 2009.  As a highly-speculative metal, traders are much more likely to buy silver when the stock markets are strong and risk trades are in vogue.  And in 2004, silver had just weathered what was essentially a crash in April and was simply mean-reverting higher in a recovery.

Silver was only strong in 3 summers out of 10, and one time (2008) it collapsed right after and another (2004) it was recovering from a brutal 33% plunge in April.  So that leaves just a single summer out of 10 (2003) when silver rallied a bit and held on in relatively normal conditions.  If you want a high-probability-for-success silver trade, bull-to-date odds running 10% or so for a significant summer rally certainly isn’t it.  As long as gold drifts listlessly, it is really hard for silver to catch a bid.

Most importantly of all, and the reason I wrote this essay, is the precious-metals stocks.  The HUI gold-stock index hit 492 in mid-May but has generally been drifting sideways to lower ever since despite the persistent strong gold prices.  Over the 5 weeks since that interim high, the HUI has merely averaged 457 on close despite gold averaging $1217.  Gold stocks remain radically undervalued relative to gold, yet they haven’t been rallying.

This lack of PM-stock performance is causing tremendous frustration amongst PM-stock traders.  I’ve been warning our subscribers about the PM summer doldrums for months, trying to prepare them psychologically for this listless PM-stock season.  They are ready.  But to those traders out there not enjoying the fruits of our research, all I can do is shrug and say “hey, it’s summer man”.  You just can’t expect too much from PM stocks while gold drifts in the doldrums.

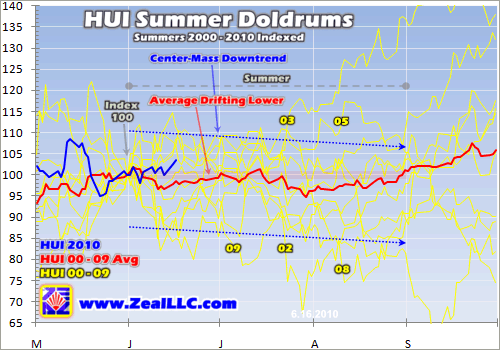
Just like its primary driver gold, the center-mass trend of every HUI summer of its entire secular bull is definitely down.  On top of this, much like silver the average of these 10 indexed years also tends to drift lower in the summer months.  This lack of summer performance is pretty amazing when you consider that the HUI has skyrocketed 1331% higher at best in this bull since late 2000.  Obviously from this chart, almost none of these epic PM-stock gains accrued over the lethargic summer months.

Like silver, the HUI did witness a couple upside outliers.  It started rallying sharply in July 2003 and didn’t look back.  That was the kind of summer every PM-stock trader fervently hopes for, but alas it was an anomaly that hasn’t even come close to being repeated ever since.  2005 saw a bump in August, but that soon collapsed back into the center-mass downtrend before summer ended a few weeks later.

The odds just don’t favor PM stocks doing anything too exciting during the summer months.  Sure, 2010 could be different and see a rip-roaring gold-stock rally.  But I sure wouldn’t bet on it.  Between 2000 and 2009, the HUI generally drifted lower between 5% to 10% above its May close to 10% to 15% below it.  Translated into this year’s HUI levels, this is a high-probability potential summer range between 385 to 500 or so.  And unfortunately the probabilities greatly favor the lower end of this range.

If you are a fellow PM-stock enthusiast like me, the dreary prospect of the PM summer doldrums as we enter summer 2010 feels like a big wet blanket.  I feel your pain, I’m not thrilled with these weak PM summer tendencies either.  But a decade’s worth of summer data from today’s secular bull forms a powerful precedent.  It isn’t wise to ignore it.  We may buck the trend and see a nice PM-stock rally before the end of August this year, but the probabilities are wildly against it.

This isn’t all bad though, there is a fantastic silver lining to this summer-doldrums cloud.  As speculators and investors, our goal is to buy low and sell high.  And thanks to these gold doldrums, late summer is the best time of the year to buy low in PM stocks.  Traders who don’t understand these doldrums get more and more discouraged as summer grinds on.  As many give up and sell by August, PM stocks typically fall to their lowest relative levels of any given year.

So at Zeal rather than worrying about PM stocks’ usual summer grind, we carefully build our shopping list for the best buying opportunity of the year in late summer.  We figure out which specific gold stocks and silver stocks we’d like to own through endless fundamental research.  And then we prepare to buy them when PM-stock sentiment waxes the most bearish and discouraged at its usual late-summer ebb.

Just this week, we finished a deep 3-month project fundamentally researching early-stage junior gold stocks.  We started with a universe of over 400 publicly-traded junior gold stocks listing in the US and Canada.  We then looked into every one and gradually whittled this huge list down to our dozen favorites.  We profiled each of these high-potential junior golds in a comprehensive new 25-page report just published.

Interestingly, high-potential juniors can often buck the weak summer trend for a couple key reasons.  First, as relatively-unknown juniors with fantastic projects become more widely known, new investors buy regardless of what gold and the HUI are doing.  Second, summer is the drilling season in the northern hemisphere when new gold discoveries are made.  Juniors spinning drills that happen to report great gold intercepts often catch a bid even if the broader PM-stock sector is flagging.

So whether you are prudently building your high-priority buy list for the late-summer sector lows, or eager to learn about incredible juniors that aren’t widely followed yet, now is a great time to digest our new junior-golds report.  At just $95 ($75 for Zeal subscribers) for the fruits of hundreds of hours of our elite world-class research into junior golds, it is a crazy bargain.  Buy your copy today and learn about these amazing juniors before everyone else does!

We also publish an acclaimed monthly newsletter, Zeal Intelligence, that analyzes the markets in depth with the explicit goal of uncovering high-probability-for-success trading opportunities in commodities stocks.  We’ve been actively trading this hot sector for a decade now, and have earned fortunes for our subscribers over the years.  Subscribe now, greatly expand your market and trading knowledge, and start thriving and capitalizing on today’s bountiful opportunities!

The bottom line is summer isn’t a great time for precious metals.  Led by gold, the entire PM complex tends to drift sideways to lower in the summer doldrums in June, July, and August.  This listless price action is driven by the combination of no seasonal gold-demand surges and the general lack of investor interest that plagues all markets in the summer months.  Sun, sand, and surf simply provide too much competition for traders’ attention this time of year.

While frustrating for traders not psychologically prepared for these PM summer doldrums, they create great opportunities for those who are.  As summer wears on and PM stocks grind lower, frustration mounts and discouraged traders dump PM stocks.  This leads to the best seasonal buying opportunity of the year in late summer, right before the huge autumn gold-buying season begins.  So relax, enjoy this summer, and start building your PM-stock buy list.

Adam Hamilton, CPA June 18, 2010

Friday, June 18, 2010

Father’s Day Weekend on TTW

What an honor to write you a post for Father's Day.  I happen to know we have some dads in our trading group whom I truly respect for the most important job in life they do- and I don't mean trading.  This will also be a short story about my own dad, and some of his quips. Hopefully you'll all see what you mean to your kids on your special day through my eyes.


I have so many bits of wisdom from my dad meshed in my brain that see me through my life.  He used to say to us, "Don't just go out on a limb.. jump up and down on it when you get out there! The branch will break, but the limb will flex and propel you up."  You have no idea how many times this comes to me during the trading day, and especially through this bear market rally.  There have been so many times I have just wanted to quit, but I remember his words all over again.  BTW- he went long the RUT at the March bottom and just cashed in recently. He beat my returns last year hands down without even blinking.


There was a Fourth of July when we were kids, and he was driving us in one of his various land yachts to see a parade.  Somehow he made a wrong turn and we were now in the procession of the parade between a high school marching band and a group of Fez wearing Shriners in those little clown cars.  That was the day he taught me that adapting to whatever life throws at you can be a good thing. It's all how you frame it - it's all in your attitude.  He had a big cowboy hat in the back seat  ( he was a beef broker, don't ask!) ... and asked my brother to hand it to him.  He rolled down all of the windows of the car and laughed, "Wave at the crowd, kids. They think I'm the Grand Marshal."  He was like that-  never just the observer while life passed by - he was the parade and the grand marshal all at once, regardless of the circumstances.  The crowd waved back at us and cheered. Rise to the occasion and laugh at the ironic.  "There are no dress rehearsals in life, he'd tell us through our lives. You get one shot at this, make it count and make it good."


I could tell a thousand stories like that about him, and each one of them is my proof that it's in the living we teach and impart what's important in life, and the skills our kids need to become the best they were meant to be. Giving up was never an option in his opinion, and "follow your bliss," was his best advice of all.  Working hard and working smart is the difference between you and the next person, he'd urge us. "When success comes knocking at your door, above all else… remain humble."


He lived his own wisdom and had great success in life mingled with smaller failures that he turned into stepping stones. His life is one of those "starting with nothing but a dream and going well beyond his wildest imagination" stories.  But if you were to ask him what his greatest success and happiness has been, he'll tell you it's his children and grandchildren, and he never lets us forget it. 


I happen to know there are many dads here on this blog just like him every single day, and you are the quiet heroes as far as I'm concerned. I have such deep respect, affection and admiration for all of you.  Your job is not easy.  Nothing important is ever easy. Keep on keeping on.


He is in his golden years now, one in the dwindling group known as The Greatest Generation, and can't jump on those limbs with a set of bad knees from old age. But to this day he is still wheeling and dealing.. often calling to ask me what I'm trading and how the market is doing.  Now he seeks my wisdom and advice... and as a daughter, you can't imagine what that means to me.  And yes, it was me who suggested he get long back in March and I never told him to bail until late April.  If I had only listened to my own advice and not bailed too early on my own March longs...  But I'm rising to the occasion, jumping up and down on the limb for all it's worth and laughing at the ironic. 


TTW Dads: Know that your children will carry your wisdom and love with them way beyond what you imagine. You are giving them a gift of value beyond measure, even when you think nothing sinks in.  Know that someday one of them might be writing something just like this in your honor because you made the hard choices in life, waved to the crowd and yes.. even listened to them and took their advice.  Know that they'll honor you because you loved them unconditionally and without limit. Love them when it's not easy to love them, when you think you're on the verge of quitting - the ROI is better than any trade you'll ever make on your very best day. Love yourself for being the dad you were meant to be.


For my Papa- Thanks for everything,  I couldn't have custom ordered a better dad if they gave me the option.  And a big, heartfelt Happy Father's Day to all of our TTW Dads!  You are incredibly special men - I really mean it.  Enjoy the day meant just to honor and thank you!  For all the dads who aren't with us anymore and we miss.. we will never ever forget you. 


Bcc: Dad – 143


Thursday, June 17, 2010

Thick as a BRIC

Are you tired of OPEX week yet? I thought so. One more day of this traders, and then we’ll see what’s really under the hood. What is our new mantra on TTW?  Think like a crook.  Would you expect any less this week out of this tape?  Exactly!   I’ve lamented a few times to my trading buddies this week that I had this week mapped out for the month, but failed to trade it with a bullish bent- oh well.. as I said to Tyler K- no looking back - look for the next trading op.  Both bulls and bears are now chomping at the bit with their particular bias in place, and next week we have a lot of things on tap with a two day Fed meeting, the upcoming G-20 meeting and the European banks with their stress tests results. Anything goes.  In any event, I suspect we’ll see some volatility return next week, and quite frankly, give me a 200 point swing any day of the week and I’m a happy camper to trade it up and down. 

But on to some charts- and I wanted to share the BRIC charts with you, as we’ve been  tracking the international charts for some time, and there are some technical events of interest on three of the BRIC charts so far.  Best to you all tomorrow, stay nimble and safe as you trade. 

brasil_eod_6_17 bric_eod_6_17
india_6_17 russia_eod_6_17


spy_eod_6_17

Wednesday, June 16, 2010

Silly-Willy $VIX

A while back I post daily $VIX chart with yellow trendlines. At that time TDSequential Countdown Buy was in progress.

Now it has completed and it is most un-tradable Countdown I've seen so far. Why? Try to set Risk Level – you will have to go all the way to the lower yellow trendline and this range is to wide to be any helpful in decision making.

So as of now all we can do is to watch Blue and Yellow (indicated by corresponding arrows) – if it goes under "blue" – I think we might be in the "summer doldrums" season. Above yellow…oh no, I really want to have some rest from volatility (I know we all don't want to watch paint dry, but sometimes too much volatility is too much)


2010-06-16_1929

Tuesday, June 15, 2010

Distancing myself from intraday noise

As a lot of regulars noticed I've been mostly absent from DISQUS during the day.  Firstly I am exploring modern slavery opportunities (AKA "cubicle slavery") – which are very bleak and not so well compensated anymore (not even as well as 15 years ago – I wonder – why those GuberMint a…people trying to convince sheeple that "wages are rising" – hell NO… NOT even in "inflation NOT adjusted terms"!!!


Shielding myself from intraday noise does its trick – I waste less time watching unpredictable tape, I have MORE time and desire to look at the daily charts at night and I am [theoretically] less tempted to close profitable positions…

Why "theoretically"? Because no longer than yesterday I was unfortunate to take a look at the real time quotes and…you guessed it right – I closed entire SPY Jun111 and OIH Jul109 long calls positions.  Not that the size of that position would make any difference, but it just proved that I still have to work on "stay with the trend" trades…I'll get to that right after finishing washing dishes while making another trading stake…


Back to the charts

A while back right at the end of April either in one of the videos or posts I mentioned that "there is TDSequential Countdown 12 Sell on Weekly SPY chart and many others and 12 sometimes produces sudden strong selloffs"

Selloff that was, but of course I could not have imagined the magnitude of so called "flash crash" and …paid huge monetary price (got hit on the "bad" trade AND on the "good" trade) and, probably even bigger emotional toll.


Getting back to "weekly countdown" – this very week we might see "13" countdown sell appear on the charts.  Coupled with retest of lower side of Andrews Pitchfork (which is pretty much an important trendline at the same time) and on DAILY chart – possible busted upside channel breakout – market might just surprise bulls next week (quite similar as bears were "surprised" last few days.  I hate to be right and not to make money!

2010-06-15_1701

2010-06-15_1701_001

Monday, June 14, 2010

EURO Channel Grandeur

Was browsing through the charts and EUR - /6E channel caught my attention.  Euro was in non stoppable decline for almost 6 months now and nothing goes on forever. Looking at the way it tested lower PRS 133 line multiple time during last few weeks and upcoming Fibonacci Time Series 144 off November 2009 high I would be very tempted to say that some directional change is coming. Meanwhile – I am watching just like everyone else.

2010-06-14_1903

Friday, June 11, 2010

Oil Stocks Deeply Oversold


Adam Hamilton     June 11, 2010     2501 Words

Oil stocks have been hammered especially hard in the recent stock-market correction.  With both the general stock markets and price of crude oil falling sharply, the oil stocks didn’t stand a chance.  The result of all this carnage is deeply-oversold oil stocks, a fantastic buying opportunity for speculators and investors.

Oil stocks, of course, are in the business of exploring for and producing crude oil.  Thus it is not surprising that the price of oil is one of their primary drivers.  Higher oil prices make oil more profitable to produce, and the greater an oil company’s profits the higher its stock price will be bid.  So oil-stock traders naturally watch the price of oil closely.  But provocatively oil shares its primary-driver role.

This sector’s other primary driver is the general stock markets.  When the S&P 500 (SPX) is rallying, oil stocks climb in sympathy even if oil happens to be flat.  When the SPX falls sharply, oil stocks follow it lower even if oil is rallying.  So like most commodities-stock sectors, the fate of the oil stocks is inexorably intertwined with the ongoing fortunes of the general stock markets.

A couple years ago I did a study on the relative influence of oil and the SPX on oil stocks.  Both had nearly identical correlation r-squares (nearly 90%) with the flagship XOI oil-stock index between 2003 and early 2008.  Sometimes oil was more important, and sometimes the SPX was.  But the oil stocks’ performance was the best when both these primary drivers were rising and the worst when both were falling.  And often oil prices moved with the SPX as stock-market fortunes influenced commodities traders, something we’ve seen recently as well.

Since April, both crude oil and the general stock markets have suffered through the largest corrections of their cyclical bulls.  Seeing both of oil stocks’ primary drivers down hard simultaneously had a devastating impact on oil stocks.  Widespread fears, most of which were pretty irrational, drove oil stocks down to unbelievable lows.  If you want to buy low, fear is your friend.  This week it drove the best oil-stock buying op that we’ve seen in at least a year.

To understand how deeply oversold oil stocks became this week, you have to understand the technical context.  I’ve included cyclical-bull charts for oil and the oil stocks, which are quite compelling.  A third chart, the SPX cyclical bull, is also very important for oil stocks.  But I discussed that last week in another essay on the general commodities-stock buying op, so here I’ll just reference last week’s SPX chart.

We have to start with oil, which has just weathered the biggest correction of its entire cyclical bull.  In addition to the usual oil technicals, this chart also shows oil relative to its 200-day moving average in light red.  This important metric from my simple yet powerful Relativity trading system helps traders identify and capitalize on excessively overbought and oversold conditions in real-time.

Like everything else during the infamous stock panic, oil was driven to irrational deeply-oversold levels in late 2008 and early 2009.  But since then, it has skyrocketed 152% higher at best in a powerful cyclical bull.  This performance is stupendously good, reflecting how silly the low oil prices were in early 2009.  For reference, over a similar timespan the flagship SPX stock index only rallied 80%.  Oil has been a rockstar!

Like all bull markets, oil periodically experienced sharp corrections along the way.  These are healthy and normal events that rebalance sentiment, keeping greed from getting too excessive before a bull climaxes.  Prior to our latest correction, the first 4 oil corrections averaged 15.4% over 24 trading days.  And as you can see above, these corrections were all very similar in magnitude with no major outliers.

Despite these sharp corrections from time to time, oil continued to power higher on balance in a strong uptrend.  By early April 2010, it was approaching $87.  This was a far cry from the ridiculous $34 levels it had briefly languished at just 14 months earlier.  After topping, oil consolidated high in mid-April averaging $85 on close over the subsequent 3 weeks until the SPX topped on April 23rd.

At that point, the US stock markets started pulling back.  And as is usually the case, retreating stock markets spawn endless worries about the economy.  When oil-futures traders see weak stock markets, they assume the global economy must be weakening too and therefore near-future oil demand won’t be as strong.  So oil tends to get sold in sympathy with major SPX retreats.

If you compare the oil chart above to last week’s SPX chart, the temporal correlation between oil corrections and SPX pullbacks and corrections is dead on.  Since last summer, the big oil corrections noted above have usually coincided with major SPX retreats.  In addition, weak stock markets drive flight capital into the US dollar and Treasuries.  Since oil is denominated in US dollars, dollar rallies drive global oil prices lower.  Thus SPX retreats hit oil on two fronts, the economic-sentiment one and also the stronger-dollar one.

The net result of the biggest SPX correction of its cyclical bull and the strong dollar rally since late April was the sharply-lower oil prices we’ve just seen in oil’s 5th major correction.  This all-important flagship commodity plunged 20.0% lower over 36 trading days ending in late May!  In addition to being about a third bigger and half-again longer than the average of the previous 4 corrections, this latest one drove oil below its uptrend’s support and 200dma to deeply-oversold levels.

Oversoldness is measured from a gradually-changing baseline, and the 200dma is the perfect one.  Relative to its 200dma, oil fell to its lowest levels in 12 months.  Between 2005 and 2008 prior to the stock panic, we used a relative trading range for oil of 0.98x to 1.25x.  Under 0.98x was very oversold, the time to go long.  And when oil surged over 1.25x its 200dma it was very overbought, the time to close longs and add shorts.  By late May in this latest correction, oil plunged under 0.91x its 200dma!  With the exception of the wild stock-panic span, oil hadn’t been this oversold since early 2007 when it traded in the $50s.

While oil’s correction matches the SPX’s own perfectly, another important psychological event happened right before it began in earnest.  On April 20th, Transocean’s Deepwater Horizon drilling rig exploded in the Gulf of Mexico.  A couple days later, it sank in 5000 feet of water.  Of course the tragic wellhead blowout that doomed this rig also led to the catastrophic oil spill in the Gulf that is saddening the world today.  Much of oil’s correction coincides with this growing oil spill, so some analysts claim the two are related.

Fundamentally though, this doesn’t make any sense.  The horrible economic impact of this massive oil spill has understandably fanned anti-drilling sentiment to previously-unimaginable heights.  This oil spill will make drilling much harder and more expensive in the future as oil companies are forced to jump through endless new hoops.  Any event that reduces future supply is fundamentally bullish, not bearish.

Even if this tragic oil spill had never happened, oil still would have experienced its largest correction of this bull because the SPX was weathering the largest correction of its own bull and the US dollar was soaring.  If anything, the Gulf oil spill’s psychological impact on future drilling probably retarded oil’s latest correction a bit.

With both oil and the SPX down sharply in their biggest corrections of their bulls, the oil stocks were doomed to spiral lower.  And they certainly did!  This next chart looks at the XOI oil-stock index, which has just fallen off a cliff.  While very painful for existing oil-stock investors, this massive decline has driven the best buying opportunities we’ve seen in oil stocks since at least last summer.  They are deeply oversold.

As oil stocks didn’t fall as low as oil during the stock panic, they didn’t rebound as far as oil after it passed.  The XOI is only up 48% at best in its cyclical bull to date, well underperforming oil’s 152% and the SPX’s 80%.  This is certainly disappointing, but it is largely explained by the gigantic oil stocks that dominate the XOI.  Not only do they typically trade at lower valuations than the broader markets, but their market capitalizations are so enormous that their stocks are slow to move.  Kind of like oil supertankers.

The XOI’s major retreats prior to this latest correction mirror oil’s exactly, and of course most of oil’s mirror the SPX’s.  But the XOI has been more volatile than either of its primary drivers.  Running between 7% to 16%, the standard deviation of the XOI’s pullbacks and corrections was much wider.  The first 4 prior to today’s averaged 11.1% over 26 trading days.  This helps show how crazy the XOI’s latest correction has been.

Between April 23rd, the very day the SPX topped but 3 weeks after oil did, and this Wednesday the XOI plunged 22.0%!  As you can see in the chart, this correction was gigantic.  It doubled the preceding bull-to-date average over a period of time about a quarter longer!  The result was a shattering of the XOI’s consolidation support line and deeply-oversold levels approaching a 14-month relative low.  Oil stocks were just taken out behind the barn and shot, practically abandoned.

The elite oil companies are so enormous that the impact of a 22% loss in the XOI is staggering.  At the end of April, the 13 XOI component companies had a collective market capitalization of $1232b.  Meanwhile the entire Dow 30 sported a market cap of $3638b, or $3154b if you remove its two giant oil-stock components (XOM and CVX) that are also in the XOI.  So the XOI oil companies alone were almost 40% of the size of all 28 non-oil Dow 30 components!

This implies a total loss of elite-oil-stock market capitalization in this correction approaching $267b!  A 22% correction in the major oil stocks is a huge deal!  Of course the catastrophic plunge in the former British Petroleum exacerbated the overall XOI decline.  In late April, BP alone represented around 13% of the entire market cap of the XOI oil-stock index.  Peak to trough since the Deepwater Horizon explosion, BP’s stock has lost a staggering 52% of its value.  This translates into around $90b in market-cap terms.

So without BP stock’s death spiral, the XOI’s recent correction would have been milder.  But not dramatically so.  As BP’s stock was gradually cut in half as the toxic crude continued deluging forth from its deep gusher, its influence in the XOI waned.  At worst, with a 1/8th weighting and 50% plunge, it accounted for about 6% of the XOI’s 22% correction.  But the reality is probably more along the lines of 3% to 4% thanks to its declining weighting.  So even ex-BP, the XOI’s recent correction was very large.

The oil-spill psychology certainly had a major impact on this steep oil-stock decline.  The endless oil-spill images and coverage is making everyone feel sad and helpless.  Though this was the first disaster after over 600 deepwater wells (a water depth beyond 500 feet) drilled in the Gulf of Mexico, it has vilified the entire oil-stock sector in the minds of pandering politicians and dimwitted Americans.  One blowout at one well owned by one company has tarred this entire sector with a brush of loathing.

But while this spill is terrible and catastrophic and tragic, the world economy marches on.  The world is still consuming crude oil at far-faster rates than new reserves are being discovered and brought online.  With this kind of supply-demand imbalance coupled with half the world’s population in Asia rapidly ramping up its per-capita energy consumption, higher oil prices for years or even decades to come are inevitable.  The only source for this oil is the oil companies, all of which except BP had nothing to do with this spill.

The Marxists running Washington are making this situation even worse for American consumers and more bullish for oil prices.  Now they consider a 1-in-600 catastrophic failure a high-probability event and have banned deepwater drilling.  This kneejerk reaction is driving drilling rigs to other countries.  Oil companies need to make reservations to lease these rigs years in advance.  So American oil production in the Gulf is going to be lower for years to come thanks to the Obama Administration’s irresponsible grandstanding.  This virtually guarantees higher gasoline prices for American voters for years to come.

Higher oil prices, whether driven by Chinese and Indian consumers or knucklehead American politicians, are great for oil stocks.  So this deeply-oversold buying opportunity created by the combination of a large oil correction, a large SPX correction, and oil-spill psychology should be seized by prudent speculators and investors.  Many smaller oil producers actually fell much farther than the giant majors of the XOI.  The small oil-stock bargains are the best we’ve seen since the stock panic in many cases!

At Zeal we’ve been aggressively buying oil stocks in recent weeks as the XOI plunged.  Most of these purchases were made in our popular weekly Zeal Speculator newsletter.  We’re sifting through the carnage to find smaller high-potential oil producers drilling and pumping in promising oilfields here in the States and abroad.  These small oil stocks should easily double over the next year as oil and the SPX recover, and it wouldn’t surprise me to see them triple or quadruple.  Today’s opportunities are amazing.

A lot of investors are confused and confounded by the volatile stock markets, but you don’t need to be.  My life’s work is studying the markets, understanding what is driving them and why, and capitalizing on these trends with high-probability-for-success trades.  You can share in the fruits of my research company’s labors and greatly deepen your knowledge of markets and investing.  In this realm, knowledge is power that short-circuits destructive greed and fear and leads to multiplying wealth.  Subscribe today to our acclaimed monthly Zeal Intelligence newsletter and start capitalizing on the endless opportunities!

The bottom line is oil stocks are deeply oversold today.  A sharp general-stock-market correction spawned the pessimistic economic psychology that led to a concurrent sharp oil correction.  As always when both of their primary drivers are falling fast, oil stocks got hammered.  But this time was even worse due to the flood of negative emotions the terrible oil spill has understandably unleashed.  Oil stocks were sold with reckless abandon, leading to some of the best bargains since the stock panic in some cases.

But while the irrational oil-stock fear we’ve seen in recent weeks will soon pass, the global need for crude oil will not.  As always after oil-stock corrections, this sector will be bid back up almost as fast as it fell.  Contrarian speculators and investors willing to fight the crowd and buy today’s bargains before mainstreamers catch on will be richly rewarded.  Oil stocks are deeply oversold, and such emotionally-driven conditions never last.

Adam Hamilton, CPA June 11, 2010

Thursday, June 10, 2010

Wacky Thursday (if you were a bear)

Yesterday in the DISQUS comments section I posted 30 minutes SPY D-Wave chart.

It looked like possible 1-2 and my thinking was reinforced by TDSequential Countdown 13 Buy completed right into the close (it was deferred from 6/8 14:30PM [meaning "13 has to be below 8"]) Here is that chart for your convenience.

2010-06-09_2137


Let see what we have today.

2010-06-10_1918

So, bounce we had (I like to go Trade-Guild.net site after close – in order not to influence my vision – and see that yesterday's Brandt's post was named "Bounce" as well – we see things through different prism per se, but quite often very similar in terms of action)


Today's action was, no questions, a killer for anyone holding bearish positions, especially in derivatives – IV collapsed before open and bears were hit from both directions.  But as seemingly bullish today was – I am not yet convinced that it is really a beginning of UP wave.

WHY?

Green arrows point to low of wave 2 (possible up wave) and corresponding RSI crossed into "bear land" – below 40 – which it should NOT do if it is a corrective wave (such as w2 or w4).  AT the same time (see red arrows) w2 of possible down wave has complied with this requirement and RSI has not move above 60, so for now it does look like counter trend move.

BUT (big one too) – I will wait with final decision till Setup or Sequential (could be on different timeframes) confirms top for w2 (of possible down wave)

And here is 20min SPY chart (20min signals were amazingly accurate lately) and it has target at 110.50 and. most likely, by 10:30-11:30 tomorrow it will be touched and IF it will turn down there – I might look for some long puts plays.

2010-06-10_1930

10min chart (not posted) looks quite similar in terms of wave, but suggest slight downside tomorrow morning first.


On the longer term direction: quite frankly, new [changed] wave structure would explain that 23% only w2 back in July 2009 and if so – wave 4 could go as low as 950sh and it still going to be bullish wave up.  I am just speculating, but I think we are done with volatility and will be just gently drifting down over the summer.

Wednesday, June 09, 2010

Legends of a Fall

Whipsaw Wednesday lived up to the name today, as we all watched the tape do a retrace, and then the afternoon sell-off (again.) Benny's words couldn't save it, the Beige Book couldn't save it- the technicals on the charts are telling the story for now. Good job to everyone for the coordination this week so far, but we have two more days left to navigate and OPEX week to anticipate. With that, let's look at some observations on the charts, and as always, proceed with caution.  Keep in mind, if we approach that 1040 level again, this will be knock number three at that door, and we continue to put in lower highs and lower lows- the most simple definition of a down trend.  Additionally, for now.. we continue to see bull pattern after bull pattern flake out- another hallmark of the resumption of a bear market.

Your homework for tonight:  As you look at the AB=CD pattern on the first chart, we have the first portion of A = 8 candles.  A-B = 22 candles.  BC= 8 candles.  We are 4 candles down now, if this pattern turns out to be harmonic in both price AND time, when would it possibly end?   And remember.. this is all assumption we do have this pattern in hand. 


spy_eod_6_9 spy_large_eod_6_9
spx_time_6_9 aapl_eod_6_9_001


indu_eod_6_9

Welcome to all of our new posters!  Glad to have you onboard!  :-)


Good trading tomorrow TTWrs!  Wind it up!