Thursday, September 30, 2010

Dojies Dance

2010-09-30_2209


Are we observing so familiar by prior topping formation series of dojies glued to the same level day after day? Is FujiSan's AB=CD patters going to work this time? Is Andrews Pitchfork going to stop it this time?  We might ask a lot of questions and make best guesses and place the bets to the best of our abilities.  Quarter is over, economy is in the dumpster, college graduates have no jobs, no income and $200,000 loans – is that the next one WE are going to repay?  I am holding my long puts – in a way I am glad I am not involved as much as before in intraday business – my "other initiatives" starting to come to life little by little – I guess I am growing up and stopping to put all eggs (efforts/money) in one basket.

2010-09-30_2206

Tuesday, September 28, 2010

Booooring….

Not much to report, nothing has changed today, stochastic sell weekly still there, except for bleeding theta nothing changed.  I will hold my long puts position for few more days, I normally go with deep in the money and at least 3-4 months put options, mostly for leverage…


2010-09-28_1906

http://trading-to-win.com/ExamplePort.aspx


If you recall my "example short portfolio" opened back in September 2009 – as of now, 1 year later it shows about 10% loss – nothing to write home about for bulls or bears…and just few weeks ago it was slightly in green – that was surely the year of range bound trading, if not for that May 6th flash crash I could say that I traded that year quite well…but as you know I got hit hard on that day and it took a while to get back to the market…it felt like I was lost in the ocean for a while…little insignificant human being in the middle of market tornado…


VIX is still in this falling wedge looking thingie, weekly stochastic buy, but it does not manifest itself immediately.

2010-09-28_1909

2010-09-28_1910

…and GS posted Countdown Buy 13 on daily (aggressive for now), still – does not look like it is poised to run

2010-09-28_1912

…boooring…

Monday, September 27, 2010

Stochastic Sell on Weekly blinking

Here is familiar /ES weekly chart ( featured just yesterday in video) and today has brought us some interesting change of winds…we have (so far) stochastic sell (well – week just started, but ..as of today – that is what it is)


2010-09-27_2156 

And the next chart needs no explanations for DeMark-ians


2010-09-27_2157


Trade well

Sunday, September 26, 2010

S&P500 Futures video

2010-09-25_1200


The tape tells the truth, but often there is a lie buried in the human interpretation
Jesse Livermore

(The World's Greatest Trader) 

The eye sees only what the mind is prepared to comprehend.

Henri Bergson 

(French Philosopher, 1927 Nobel Prize in Literature, 1859-1941)


Well, I thought that may be, we all will be more entertained if I post video about Lindsay Lohan  or Lady GaGa – will help search ratings as well.


Subscribe in Amazon Kindle

Thursday, September 23, 2010

TeleChart SALE ENDS Oct 4th!!!

Worden is running unadvertised sale available through affiliates (which I am - AFCode  638 )  for TeleChart Platinum (one of the best, most reliable real time charting packages on the market, not to overlook unparalleled scanning/programming capabilities of TC/StockFinder )

If you buy 8 months of service – you get extra 4 months free, that is 50% BONUS!

image

You have to call 1-800-776-4940, give them AF Code  638  to receive this outstanding offer!

Wednesday, September 22, 2010

Watching market leaders

The answer I'd like to know:

"Has it ever been a time when Market Leaders were not big industrial, technology, financial, or even automobile or airspace companies, but I WANT TO HAVE THIS CRAP type of companies?" This is the nation we became???


Not MSFT, not CSCO, not X, no BA …not not not…but


Apple? Priceline? Netflix? Bide? Err.. Sorry – BIDU…?

Are we all mentally deceased???  Again? (The answer to THIS question I DO know)


Look at these charts (DeMark signals notwithstanding) and see when these companies started it ascend – few months before general market bottomed in March 2009.  These is what set us free???


2010-09-22_1716_001 2010-09-22_1716
2010-09-22_1717 2010-09-22_1717_001


And not to overlook this phenomenally successful company that will have its place in history forever…which is for average American is about 15 minutes…


enrn_timeline (CBS MarketWatch )


Of course THIS time it is different…AGAIN…

Tuesday, September 21, 2010

Comment Cleaner!

[Picture is a find of Gold_Gerb]

image

Interesting action today..I would not be full of it (as oppose to my usual mental state) if I'd say that today's action was expected and good for those who had a plan and traded that plan. I added (well – my orders got filled close to SPY 115) yet another few long puts and now instead of "very small short position" I am holding "small short position" (well – with options it is ALWAYS small – not even suicidal maniac like myself will commit more than 10% to derivatives.)


SPY jumped to TDRL on daily and managed to close under it, red on the session after yet another non-event FED meeting.


2010-09-21_1936 

UUP…poor's man dollar index printed TDSequential Countdown BUY 13 today on daily.  Close is within TDRL area for prior buy setup.

2010-09-21_1929

Everyone is 100% certain that market finally broke out on the open and there is no way back…it could be so, but paranoia keeps me alive and first time in a while I am bearish now (as some of you recall Special K turned bullish on July 2nd and I followed her footsteps after DeMark-ian woo-doo confirmed bullish price flip), then we turned bearish when SPY was unable to move about TDRL area in the beginning of August, and once again we turned short term bullish right on the back to school day and corresponding Buy Setup Daily.  DeMark0ian faith is not a Wholly Grail..but coupled with such a great traders who gathered on this site it shows great potential (when we do not let our biases to ruin the day.. or two… or few months…)

Once again – don't get me wrong – I am NOT expecting big decline right now… may be to 107 area and then we will see.

Trade well

Monday, September 20, 2010

Monday Mania

Welcome to the rubber room, known as your free market. ;-)

Keep in mind as I mentioned in the previous post, we're still 8 trading days from EOQ now, five days for them to place their orders and have them settled. If you think AAPL can't go any higher, just remember round numbers theory, and for all we know they're taking it up to 300.   /HG was pulling back today, and TLT closed green, so let’s monitor them as well for possible early clues.  Don’t say I didn’t tell you last night to watch the RUT and TRAN- they pump those puppies with the greatest of ease to run the shorts.  TRAN did not finish as strong as the RUT today though, so there’s another thing to monitor.

Now.. before you retreat to your fetal positions for the evening, I have one chart to share tonight that isn't too bear friendly.. yet.   This is a bearish Gartley. Should /ES exceed the .786 Fib, forget you ever saw me or this chart. I'll be in Mexico.

es_gartley_9_20

Good luck tomorrow, traders. 


 image DDT Here


On September 14th on Members SIte 

( Do not spit against the wind ) I wrote:


"I plan on getting some short positions at SPY 114.50sh area with tight stops."


So, here we are now, except for, as I mentioned before, "really small long puts position I grabbed during Friday's morning bounce" – I am 100% all cash.  New week did provide some "excitement" – nice run up into FED meeting.  So, lets look at the charts.


Here is 30 min SPY D-wave in progress – target price for W5 is almost here, I have no doubts it will be hit and possibly exceeded tomorrow either before or right after FED yet another non-even statement.


 2010-09-20_1707

Hourly SPY shows possible completion of sell setup tomorrow around noon.  Interestingly enough – today right at market open – hourly TDCountdown for both TDCombo and TDSequential have been completed with immediate start of momentum Sell Setup.


 2010-09-20_1710

And last, but not least – looking at my personal long time favorite 4hours chart we can see that today's price action brought SPY all the way to TD Risk Level for most current Sell setup.

 2010-09-20_1712


OK..I lied ..just like always…one more chart – daily SPY – needs no explanations, same interesting picture – right at TDRL and 62% – just were I wanted it!


2010-09-20_1717

ICSC-Goldman Store Sales
[Bullet
7:45 AM ET

Housing Starts
[Report][Star]
8:30 AM ET

Redbook
[Bullet
8:55 AM ET

4-Week Bill Auction
[Bullet
11:30 AM ET

52-Week Bill Auction
[Bullet
11:30 AM ET

FOMC Meeting Announcement
[Report][Star]
2:15 PM ET

Sunday, September 19, 2010

Sunday Evening Huddle

Fortunately for serious minds, a bias recognized is a bias sterilized - Benjamin Haydon


Let’s keep that quote in mind going into a new trading week. While we have plenty of evidence pointing to a possible pullback this week, they never make this easy, and will keep playing the same game of gapping up overnight leaving little chance to get long during regular trading hours, much less short this puppy to the full extent it deserves. (note my bias there?) I’m working on it, believe me. There were some absolutely beautiful long set-ups last week, and the question is: did you find something like that to trade while waiting for Godot? Get in both lanes this week, TTWrs. I want to see you pillage and conquer this tape like you’ve done so many times before. By the time Friday rolls around, let’s see some high fives and a few towel snaps for a great week that was well done. We don’t “do” defeat here- it’s not in our vocabulary. The fresh slate begins tomorrow (for you FX traders, tonight.)

Before I share a hodgepodge collection of some possible leading indicator charts (you all covered the general market in spades in the last post,) I’d like to once again welcome all of our newbies- who will hopefully stick around, as we really do appreciate what you bring to the table and add to our ongoing discussion. TTW is a place where we throw everything but the kitchen sink at this tape day in and out, with a very good rhythm, I might add. While DDT started this as a place to discuss DeMark analysis, all ideas and methods are welcome here. We remain humble traders, and thrive on learning something new each and every day. The thrust is to not only personally profit, but hopefully help each other profit as well.


Gann chart for SPX, coming into an important Fib day tomorrow off of the July pivot low

spx_gann_9_20

copper_9_20 crb__9_20
wtic_9_20 ssec_9_20


One last chart for good measure. They’ve really been pumping the Qs lately, and let’s face it, this isn’t exactly looking bearish at this point. While it’s possible this had more to do with OPEX than anything else, keep an eye on sector rotation tomorrow. If they’re going north, keep an eye on the RUT and TRANs for shenanigans.

qqqq_9_20

Now.. while I’m working on my bias all the time as it applies to trading, I have a very strong bias to this musician. 40 years ago, yesterday, RIP Jimi. Lets put a little voodoo on Lloyd this week, shall we? ;-)

Friday, September 17, 2010

Cheap Commodities Stocks


Adam Hamilton     September 17, 2010     2211 Words

After weathering a lackluster grinding summer, commodities stocks are poised for a big rally.  Thanks to an anomalous divergence between commodities prices and the general stock markets, commodities stocks are relatively cheap today.  This has created an excellent buying opportunity for investors.

Commodities stocks, of course, are in the business of exploring for and producing raw materials.  These resources are exceedingly important, indeed utterly indispensable for life and commerce.  Even in this young Information Age, our entire physical world is built out of commodities.  All physical movement is fueled by commodities.  And despite new resource finds getting scarcer, world demand continues to grow relentlessly.

Commodities stocks’ profits are directly driven by commodities prices.  The higher these resources’ prices travel, the greater the raw profits and margins for producing these products.  And in the stock markets, the larger any company’s long-term profits the higher its stock price will be bid.  So as the ironclad links of this causal chain show, it is commodities prices that ultimately drive commodities-stock prices.

But over the short term, sentiment heavily affects commodities-stock price levels.  Even today a decade into these secular commodities bulls, Wall Street still considers these top-performing stocks exceptionally risky for some strange reason.  So when general-stock-market psychology is happily bullish, commodities stocks surge higher much faster than the broader markets.  And conversely when Wall Street waxes bearish, the commodities-stock sectors readily leverage general-stock downside.

In light of this background, a very bullish anomaly has developed in today’s markets.  Commodities prices have been rallying strongly, guaranteeing higher future profits (and hence stock prices) for commodities producers.  Yet at the same time, the general stock markets have been grinding sideways while fighting intense mainstream anxiety.  And commodities stocks have latched on to this stock-market malaise, ignoring the rallying prices of the products they produce.

This situation is easy to see on a chart.  Commodities prices are best represented by the Continuous Commodity Index, the new name for the old-school equally-weighted geometrically-averaged CRB index.  The CCI is much more representative than today’s so-called “CRB”, which is now dominated by crude oil.  And of course the general stock markets are best represented by the flagship S&P 500 stock index (SPX).

On this chart the SPX, which dominates short-term commodities-stock sentiment, is slaved to the left axis in red.  Superimposed over that is the CCI, which ultimately drives commodities-stock profits, in blue.  While commodities prices have been rallying sharply and have returned to pre-stock-panic levels, commodities stocks have been ignoring them to languish in the broader SPX’s sideways grind.

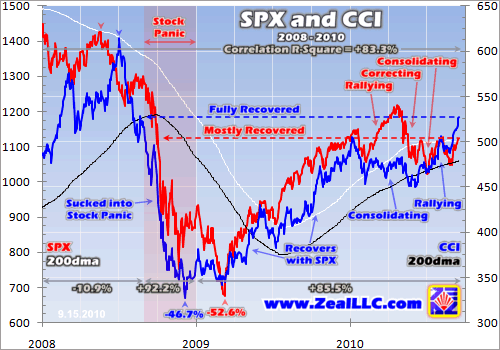
Late 2008’s epic once-in-a-century stock panic was not kind to commodities.  Technically that brutal period ran from when the classic VXO fear gauge first exceeded 50 on September 29th to when it finally fell back under that panic-defining level on December 19th.  Over that unbelievably-wild 58-trading-day span, the markets weathered a raging fear storm like no one alive today had ever seen before.

But to streamline today’s analysis, I broadened this panic span to include all of September, October, November, and December 2008.  That year prior to those fateful panic months, the CCI and SPX were completely uncorrelated.  Their correlation r-square ran a paltry 11% based on a negative underlying correlation.  Commodities did their own thing regardless of what the general stock markets were doing.

This changed radically during the panic months, where the CCI/SPX r-square soared to a staggering 92% on a positive correlation.  Investors worldwide were so terrified that they dumped everything regardless of fundamentals.  As the stock markets plummeted, futures traders feared a new global depression so they jettisoned commodities at a frightening pace.  Exacerbating this already-mighty commodities selloff, flight capital deluged into the US dollar.  The resulting rallying dollar farther weighed on commodities prices.

While the SPX ultimately plunged 53% in 10 months as a result of that panic, commodities didn’t fare much better.  The CCI plummeted 47% in just 5 months!  With both their sentiment driver (SPX) and fundamental driver (CCI) in free falls, elite commodities stocks including the world’s biggest and best producers lost between 60% to 90% of their stock prices!  Such carnage was utterly unprecedented.

Since that panic period, both general stocks and commodities prices have rallied tremendously.  The post-panic CCI and SPX rallies were very similar and intertwined, a testament to how ridiculously oversold both commodities and stocks became during the panic.  But despite this powerful CCI rally, still today most commodities-stock traders remain so skittish that they look to the SPX for guidance instead of the CCI.

This year’s first half wasn’t great for the CCI.  Earlier in 2010, commodities prices were consolidating sideways while the stock markets were still rallying.  And then when the SPX corrected sharply in May and early June, the CCI followed it down to new 2010 lows.  But ever since that early-June CCI bottom, commodities have been rallying strongly.  In normal times, commodities stocks would have followed them higher and leveraged their gains.  But lately they’ve mirrored the grinding SPX instead.

Interestingly, by early last month the CCI had actually fully recovered all its panic losses.  Meanwhile the SPX had recovered most of its own, but still remained well behind the CCI’s recovery.  It is this development that drove today’s commodities-stock price anomaly.  Since commodities stocks ignored the CCI’s entire recent 17% rally over 3 months, they are now very undervalued relative to today’s commodities prices.

In order to better understand the relative performances of the CCI and SPX since the panic, I indexed each.  This renders them in perfectly-comparable percentage terms and eliminates visual distortion.  They are both set at 100 at their closes on the last trading day of August 2008, the eve of those 4 panic months.  As each fell 10% it hit an index level of 90, 20% equals 80, and so on.  This comparison is fascinating.

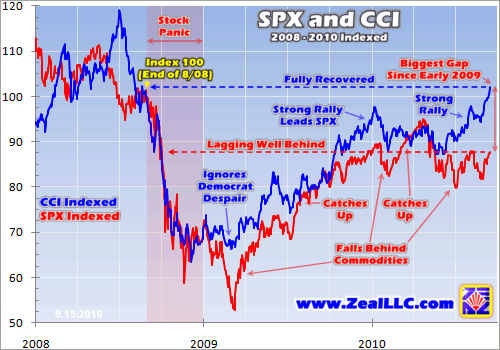
In those panic months, the percentage decay curve of the CCI was nearly identical to that of the SPX!  This is startling and remarkable.  Because of the CCI’s geometric averaging across commodities and between individual contract months within commodities, it is usually slow to move.  So to see this particular heavily-smoothed index match the SPX’s first true panic plunge since 1907 is really extraordinary.

The SPX panic reached its nadir in late November 2008, and the CCI bottomed just 2 weeks later in early December.  Ever since then commodities have been rallying on balance despite the secondary SPX low in early 2009.  Just after the Obama Administration took office in January 2009, the SPX plunged sharply.

Why?  Remember the arrogant Democrats attacking hard-working American investors, saying our huge tax burden was too low and they were hellbent on raising it?  They were also advancing scary Marxist class-warfare doctrine, an abhorrent anti-American philosophy Obama continues to poisonously spew today.  Thankfully the Democrats are about to pay a heavy price at the voting booths for their endless demonization of American small businessmen who have earned success and created most jobs.

Amazingly the stock markets were so ridiculous oversold by early March 2009 that not even the Democrat Despair could hold them down.  As they started recovering in a fantastically-profitable new cyclical bull, commodities prices followed them higher.  There is a super-important psychological link between stock prices and commodities prices that all investors must understand in order to succeed.

The fortunes of the stock markets affect sentiment universally.  When they are rising, everyone feels better even if they aren’t investors themselves.  When they are falling, everyone feels worse.  Rising stock markets also make traders assume the global economic outlook must be improving.  And the better the world economy looks, the faster global commodities demand will grow.  So a rising stock market leads futures traders to bid up commodities prices, and vice versa.  The SPX heavily influences the CCI.

But provocatively, the SPX often falls behind and lags commodities before surging rapidly to catch up again.  We first saw this in early 2009 when Obama threatened the most massive federal-government growth and attacks on Americans’ financial freedom that we’ve seen in decades.  Nevertheless, by mid-2009 the SPX had caught up with the CCI in perfectly-comparable indexed terms.

This disconnect happened again in late 2009, when the CCI surged higher decisively while the SPX reluctantly consolidated higher.  But in early 2010 the SPX once again caught up with the CCI to match its post-panic performance perfectly.  Though the CCI corrected a bit in early 2010, at the point where the SPX caught up to it general stocks were trading at their best levels since the stock panic and commodities weren’t too far behind.

Once again for the third time in mid-2010, the SPX fell behind the CCI.  While the CCI started rallying strongly in early June, the SPX just ground sideways in its anxiety-laden summer spawned by the healthy spring correction.  The result, as you can see on this chart, is the biggest gap between absolute CCI and SPX performance that we’ve seen since early 2009.  This gap is the anomaly that is so darned bullish for commodities stocks today.

In this entire post-panic recovery, every time commodities advanced ahead of the stock markets, stocks soon surged to catch up and match commodities’ progress.  I really doubt this pattern will suddenly break today.  The SPX’s cyclical bull is alive and well, and coming out of the low summer base there is a great technical and sentimental setup for a big rally in the coming months.  Heck, just the prospect of throwing out some of the Democratic Marxists who have so damaged American economic confidence is super-bullish!

And if the SPX once again surges to catch up with the CCI’s absolute performance, it is very bullish for commodities stocks on multiple fronts.  First, commodities stocks are very undervalued relative to today’s commodities prices since they have been following the consolidating SPX instead of the rallying CCI.  So they are starting from an oversold and unloved base, which means any investor buying will have a disproportionately-large impact.

Second, a rallying SPX will improve economic confidence.  This means futures traders will likely bid the commodities prices even higher, effectively slowing the progress of closing this gap.  Of course higher commodities prices make commodities stocks look much more attractive to investors, intensifying any new investment demand.  An improving economic outlook, rising stock markets, rising commodities, and improving sentiment all feed on themselves and form virtuous circles.

Third, as the SPX rallies the fear trade including the US dollar is sold.  A falling dollar leads to higher dollar-denominated commodities prices, encouraging commodities-stock demand among investors.  This indirect dollar-negative impact of the SPX-rally-driven reversal of the fear trade will add fuel to the fire under commodities prices.  Futures traders get excited about commodities when the US dollar is trending lower.

Fourth, commodities stocks usually leverage SPX gains.  So as the SPX rallies to rejoin the CCI’s progress, commodities stocks should surge much faster than the general stock markets.  Of course nothing gets mainstream investors more excited than rapidly-rising stock prices, so this phenomenon too will feed on itself once it gets underway.  This week we are already seeing this start in smaller commodities stocks.

Each of the past times the SPX rallied to catch up with the leading CCI, commodities stocks rallied sharply.  This time ought to be even better due to overarching sentiment trends.  The majority of American investors have been hiding out in zero-yielding cash and near-record-low-yielding Treasuries since the panic.  They are tired of watching the Federal Reserve inflate their capital away.  As they start to return to the markets, they will chase performance.  And commodities stocks will likely be the best-performing sectors.

At Zeal, we’ve been preparing for the end of this anomaly since it first started developing in May.  Since then we’ve gradually layered into dozens of high-potential smaller-commodities-stocks trades with great odds of soaring in this coming rally.  Today the trading books in our acclaimed monthly Zeal Intelligence and weekly Zeal Speculator newsletters are full of fantastic commodities stocks ready to rocket.  While we’ve already seen nice gains in most of these positions, it isn’t too late for you to buy.

Despite the countless opportunities in recent months, most investors have been hypnotized by the anxious drumbeat of fear, paralyzed into inaction.  As these ostrich investors wake up and return, their trillions of idle cash have the potential to drive huge rallies.  We’ve been specializing in commodities stocks for over a decade, earning awesome returns for our subscribers.  You too can share in our knowledge, wisdom, and experience as we continue to uncover new opportunities.  Join us today!

The bottom line is commodities stocks are very undervalued relative to commodities prices today.  While the latter have enjoyed a strong rally since June, commodities stocks have languished in the stock markets’ sideways consolidation.  This anomalous disconnect cannot persist, as it is commodities prices that drive commodities-producers’ profits, and ultimately any company’s profits drive its stock price.

So even if the stock markets continue to do nothing, commodities stocks are overdue for a big rally.  But every other time since the panic when the stock markets have fallen behind commodities’ recovery, the stock markets soon surged to catch up.  This time probably won’t be any different.  As commodities stocks usually leverage stock-market gains, another catch-up rally amplifies commodities stocks’ potential.

Adam Hamilton, CPA September 17, 2010   

Thursday, September 16, 2010

Drooling all over AAPL

Few days ago I posted D-wave 30 minutes chart on Disqus thread and speculated that AAPL might jump to 280. Did not take long and it is almost there today.


2010-09-16_2110

But what is more interesting is a longer term view with PRSGuitar's 133 channel applied.


2010-09-16_2110_001

Are you thinking what I am thinking? ( Beside that I am deadly tired and thinking only about falling onto bed)

Wednesday, September 15, 2010

SPY Short term update

Not really much to say in respect to long term direction (so far upside most likely exhausted itself …mostly – short term that is), 30 an d20 minutes D-Wave and corresponding Setups are quite in agreement (meaning slight upside or quick short squeeze left and then corrective ABCs.

 2010-09-15_1851


2010-09-15_1805


UUP (poor man's Dollar index) 20 minutes chart (worked miracles lately!) hints on some ABC  bottoming action for now…

2010-09-15_1854 

In short…boring…for now – it always is right before curtain goes up

Tuesday, September 14, 2010

Back from NYC

Have to apologize for my abrupt silence, I expected to be in NYC for Saturday only, but after attending Memorial Ceremony for few friends - families decided to escape for few days and we went to Pocono and I totally was unable to access my charting/trading software, and was not really in the mood to get on the internet.


It is strange how things work in this life – after my contract with TIAA-CREF ended back in 2001, I had an interview at Deutsche Bank (I do not recall exactly, but I think it was on 76th floor of North Tower).

I was very good at was I did, and additionally – I was very good at passing interviews. But something happened during that particular interview – the moment I walked in and shook manager's hand – I could not hold myself, but be nothing but rude in response to nonsense the guy was saying.  So – there was no love story there…in about 10 minutes I stood up and said: "I am not really up to wasting MY time" and walked out.  The date was …beginning of June 2001.

In few weeks I have received very nice offer from the company in Hartford, CT – short contract, 3 months, but rate was far exceeding my expectations…so I agreed.

My contract started June 19th and was due to end on September 19th 2001.


On September 12th they offered me permanent position… and I was in CT ever since (although I don't work for that company for a very long time now)


Saved by the bell? Don't know – I would probably turn down the offer to accept any position in WTC – I had business account at Morgan Stanley branch at one of the towers and I REALLY DISLIKED those express elevators swaying from side to side – I was getting see sick…plus I am afraid of heights.


Now it is time for me to stand corrected.

My statement in the "…nothing, but bubbles" post is "not entirely correct".

YES – NOTHING HAS BEEN COMPLETED AS OF TODAY.

BUT – what I saw at the site of Ground Zero made my look again at media reports and filtering out noise – here what it is now.


Memorial constructions ARE IN PROGRESS and, according to Mayor Bloomberg, promised to be completed "on September 12, 2011, in time to mark the first decade after the Twin Towers and Tower 7 fell".


Also, 36 floors of Tower 1 have been completed as of today with 106 targeted for completion in September 2013.

Other constructions are underway as well


Next time I will have to explicitly state what "NOTHING, BUT BUBBLES" means – for me it is economy in ruins and oligarchy getting uncontrollably fatter while hard working Americans getting squeezed harder every day …

Enjoy your evening…

Monday, September 13, 2010

Bug, meet Windshield

The bears started out the day hitting the windshield- nothing new there for the past two weeks. The question remains as to whom will get the next turn at the wheel this week.

Not only do we have quad witching this week, but VIX options also expire on Wednesday, so let's keep that in mind while following that chart, too. As you’ll see below, the VIX still has an unfilled gap quite a bit down on the daily chart, however both bucky and TLT filled theirs today. This week doesn't "officially" kick off earnings with the status quo Alcoa announcement, but Thursday we have DFS, FDX, ORCL and RIMM all reporting. FDX is the one I'll be watching closely. Also, as Big mentioned late in the day, BBY reports tomorrow along with retail sales figures before the bell.

Although we have multiple T/A methods telling us there is negative divergence, many cycles hitting here or later in the week, price is still king. If the tape does drop we’ll think we were geniuses, but until then, just follow the bouncing ball and stay safe.


Today was also a POMO day, and we have two more to deal with this week, (Wednesday/Thursday.) While the first few POMOs didn't seem to make an ant hill into a mole hill, there seems to be a pick-up where that's concerned, too. Do you want to fight the Fed? Well, maybe.. but let's use some prudence with the trades we chose because they're obviously hell-bent on keeping the Flying Walendas up on the wire.

Interesting article for you on record high dollar shorts and Euro longs to read through.


“Traders Haven't Been This Short The Dollar, And This Long The Euro, In Years”

Best to us all this week- keep your wits about you, watch each others' backs, and let's make some cash this week. ;-)

vix_9_13 dx_9_13
tlt_9_13 spx_9_13


spx_gann_eod_9_13 Added Osi’s DeMark chart for you

osi dm 9 13